Revenue Analytics
تفاصيل العمل
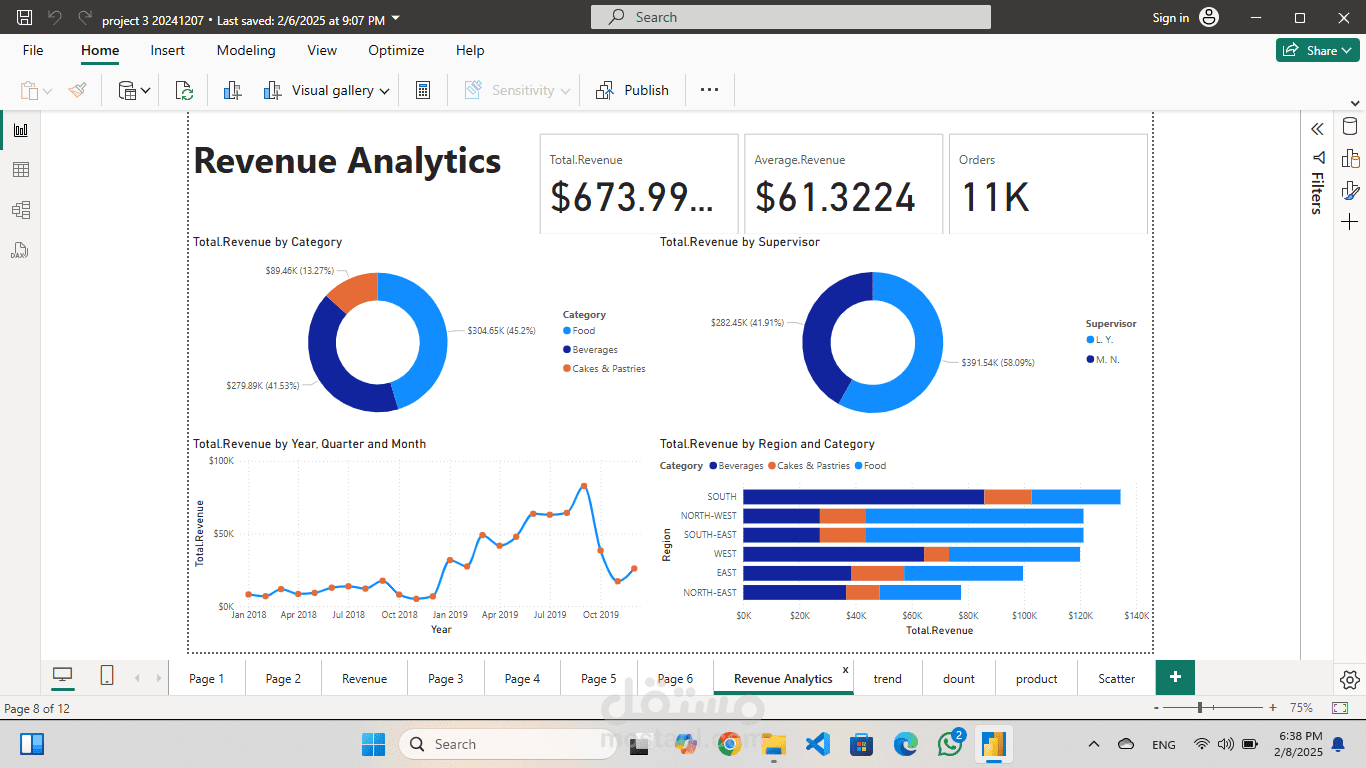
This Revenue Analytics Dashboard in Power BI provides key
financial insights:
Total Revenue: $673.99K | Average Revenue per Order: $61.32 |
Total Orders: 11K
Revenue by Category: Food (45.2%), Beverages (41.53%), Cakes
& Pastries (13.27%)
Revenue by Supervisor: L.Y. (58.09%), M.N. (41.91%)
Revenue Trend: Growth observed until late 2019, followed by
a decline
Regional Revenue: South and North-West regions contribute
the highest earnings
This dashboard helps track revenue trends, category
contributions, and regional performance.