pocolypse food dashboard
تفاصيل العمل
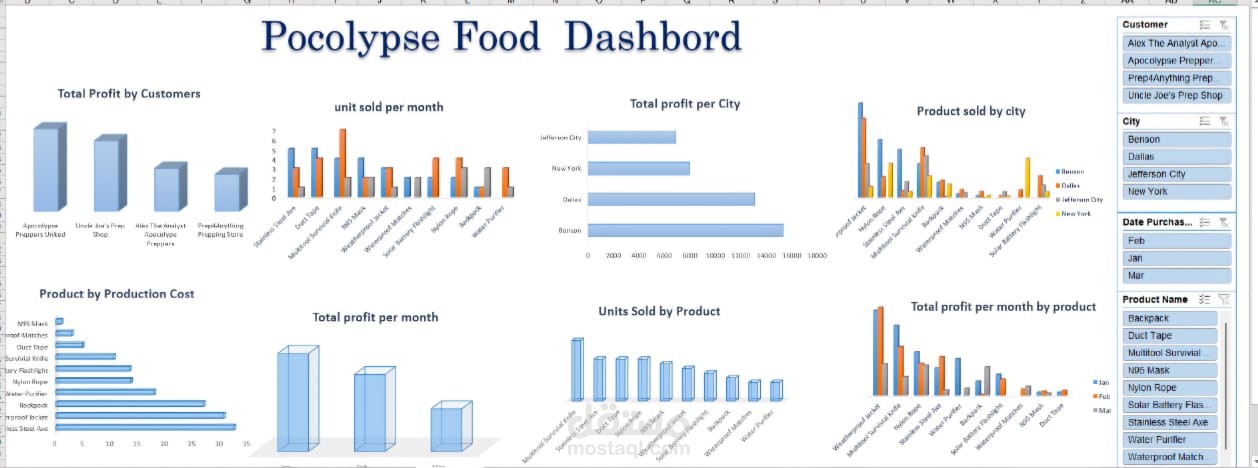
The Foodypse Food Dashboard provides a comprehensive overview of sales and profit metrics for a food-related business. Here's a summary of the key insights:
Total Profit by Customers:
Total profit is broken down by customers, with significant contributions from Main Dividends (7,000,000) and Produce Sales (1,000,000).
Unit Sold per Month:
Profit distribution by city shows Main Dividends (6,000,000) and Produce Sales (2,000,000) as major contributors.
Product by Production Cost:
Monthly profit analysis highlights Main Dividends (5,000,000) and Produce Sales (3,000,000).
Units Sold by Product:
Profit by product indicates Produce Sales (15,000,000) outperforming Main Dividends (10,000,000).
Product Sold by City:
Profit by city shows Produce Sales (13,000,000) and Main Dividends (12,000,000) as top performers.
Customer and City Data:
Key customers include Alex The Azougi App., Apocoype Pumper, and FreshJayping Ping.
Major cities: Benson, Dallas, Jefferson City, and New York.
Date Purchases:
Sales data is tracked for February, January, and March.
Product Name:
Products listed include Discreet, DuLi Tape, Melanie Sawwell, NBS Mark, Nikon Edge, Sada Gallery Plus, Stamara Steel Ave, Visitor Pathor, and Waterproof Match.