Sales Dashboard
تفاصيل العمل
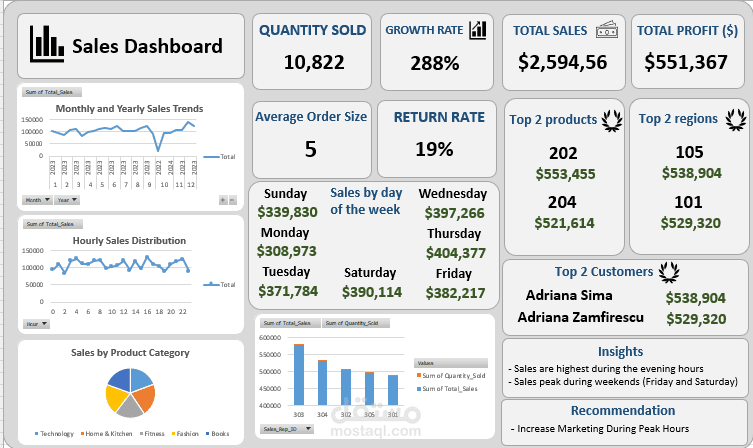
I have developed a comprehensive and interactive Sales Dashboard that provides deep insights into sales performance, tracks key performance indicators (KPIs), and helps businesses make data-driven decisions.
Features & Capabilities:
Advanced Sales Analytics – Includes Month-over-Month (MoM) & Year-over-Year (YoY) growth rates, average order size, profit calculations, and return rates.
Dynamic KPIs Section – Displays total sales, quantity sold, profit, average order size, and sales growth trends.
Top Performers Analysis – Identifies top-selling products, best-performing regions, and highest-value customers.
Time-Based Sales Trends – Analyzes sales patterns by day of the week and time of day (morning, afternoon, evening, night).
Sales Rep Performance Tracking – Compares sales reps based on total sales and quantity sold.
Interactive Filters & Slicers – Allows users to dynamically filter by product category, region, sales rep, date, and time of day.
Data Visualization & Insights – Features line charts, bar charts, heatmaps, and pie charts to represent trends effectively.
Key Business Insights & Recommendations:
Identified peak sales hours and best-performing products.
Analyzed return rates to optimize sales strategies.
Recommended strategic actions to boost revenue and enhance customer engagement.
This powerful dashboard is designed to help businesses understand their sales performance, improve decision-making, and drive profitability.