Interactive Titanic Dashboard | Power BI Data Visualization
تفاصيل العمل
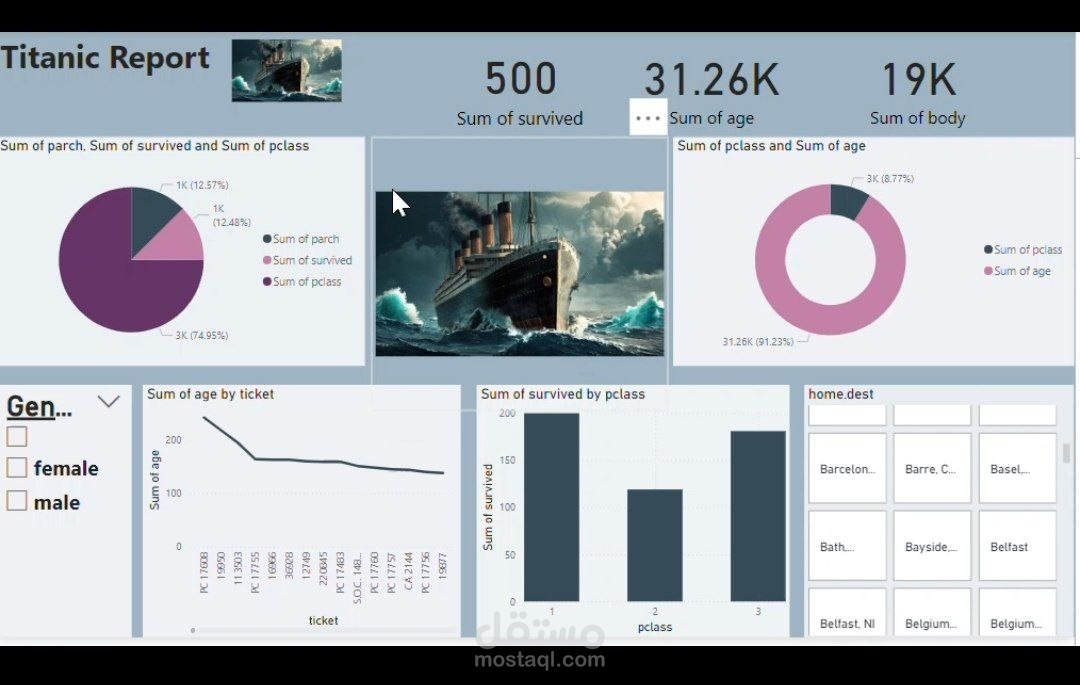
This project showcases an interactive Power BI dashboard for analyzing the Titanic dataset. It includes key insights such as passenger survival rates, demographics, and class distribution, using advanced data visualization techniques. The dashboard provides clear, data-driven insights for better decision-making.