مشروع تحليل البيانات الاستكشافي
تفاصيل العمل
Project Overview:
In this project, I analyzed a dataset containing information about books to uncover insights related to:
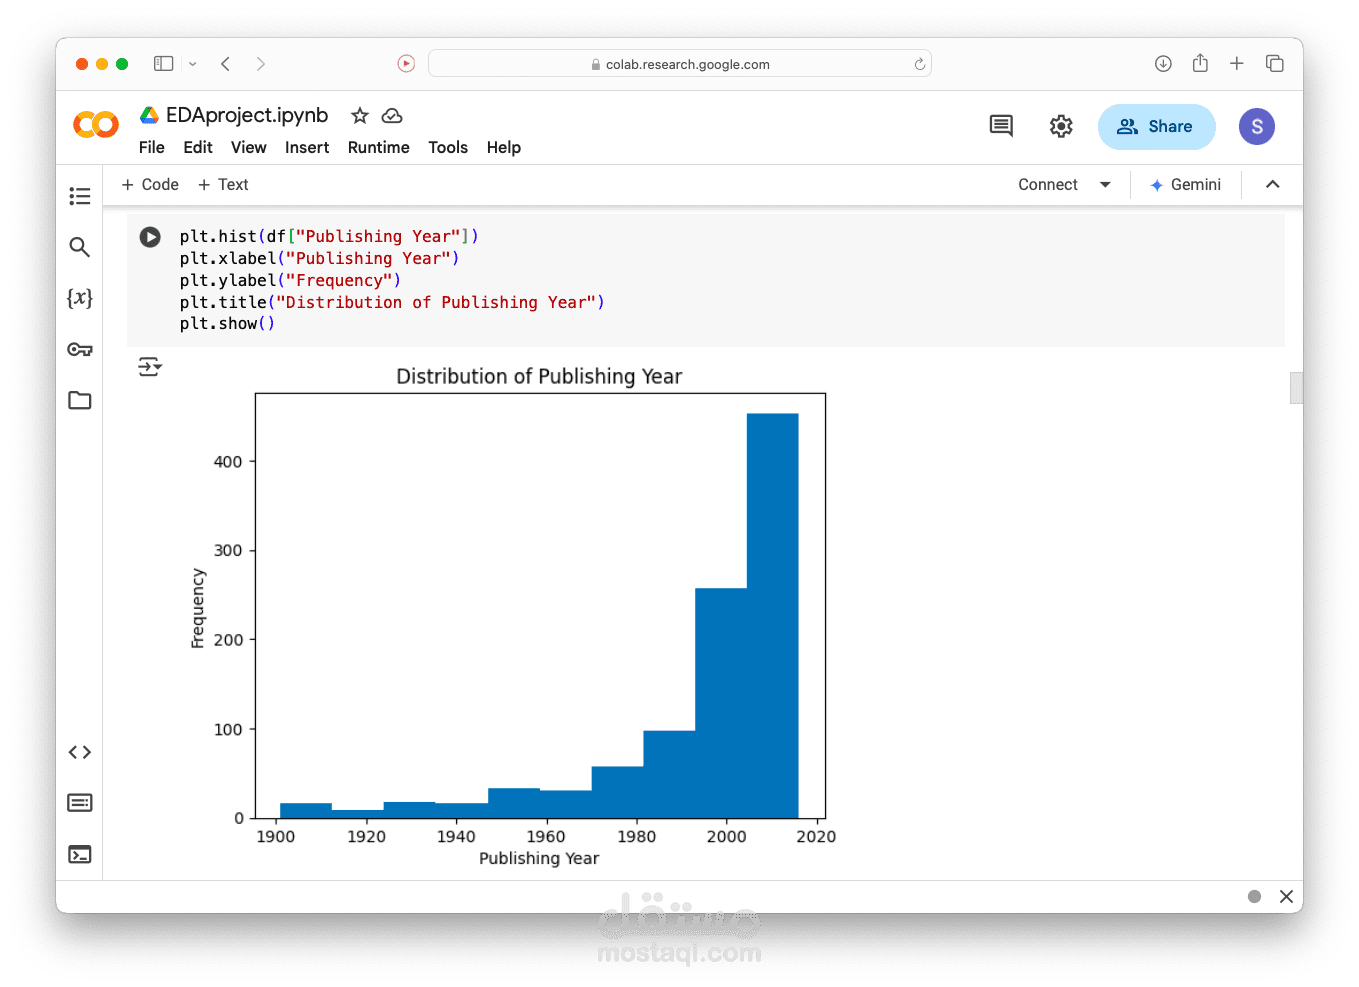
- Distribution of publishing years
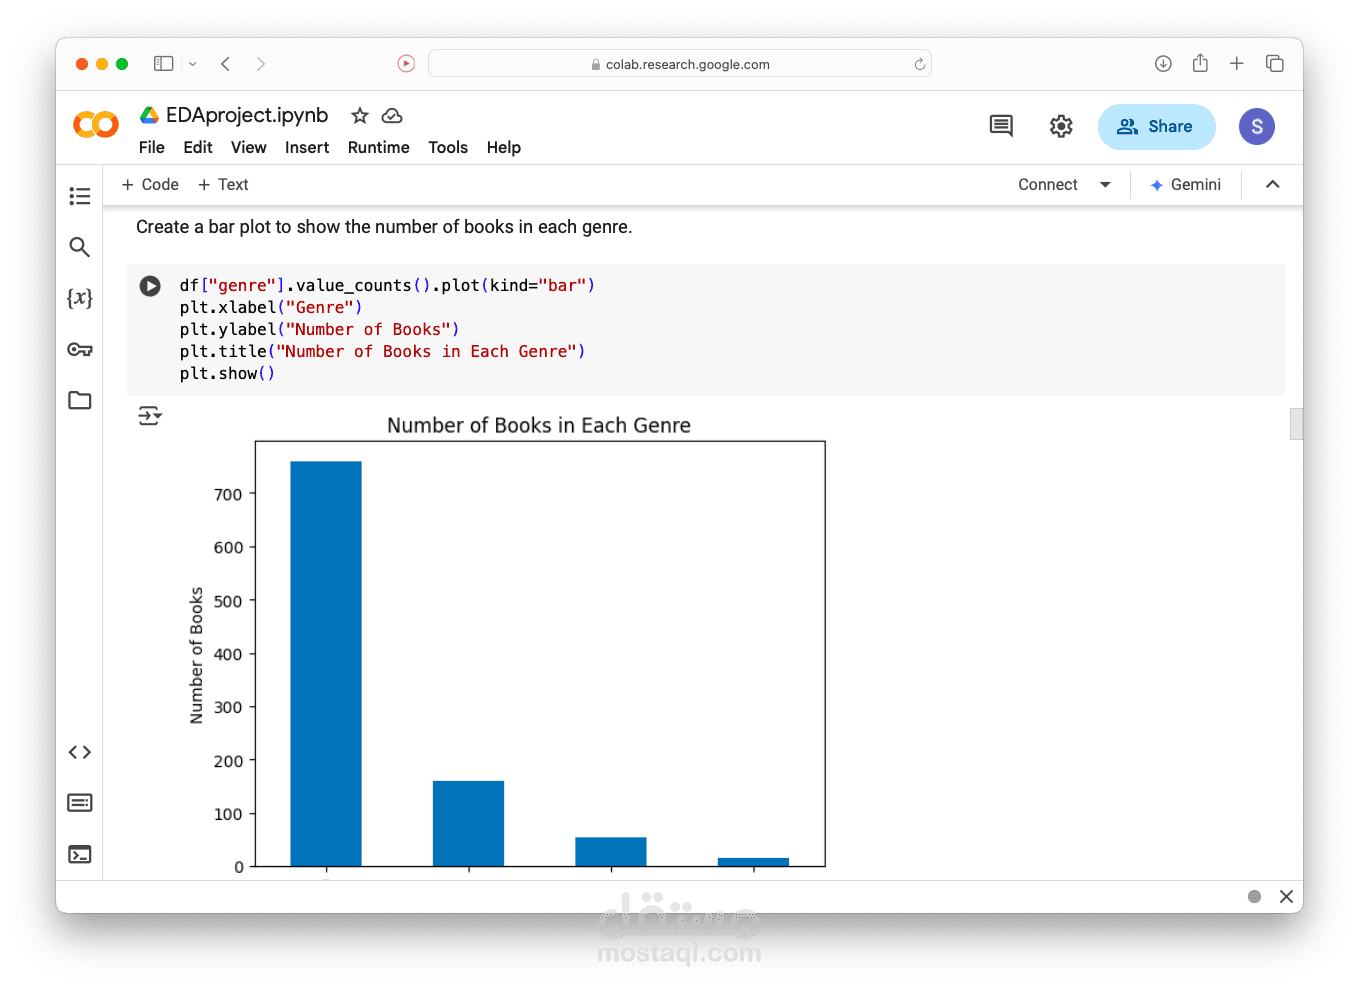
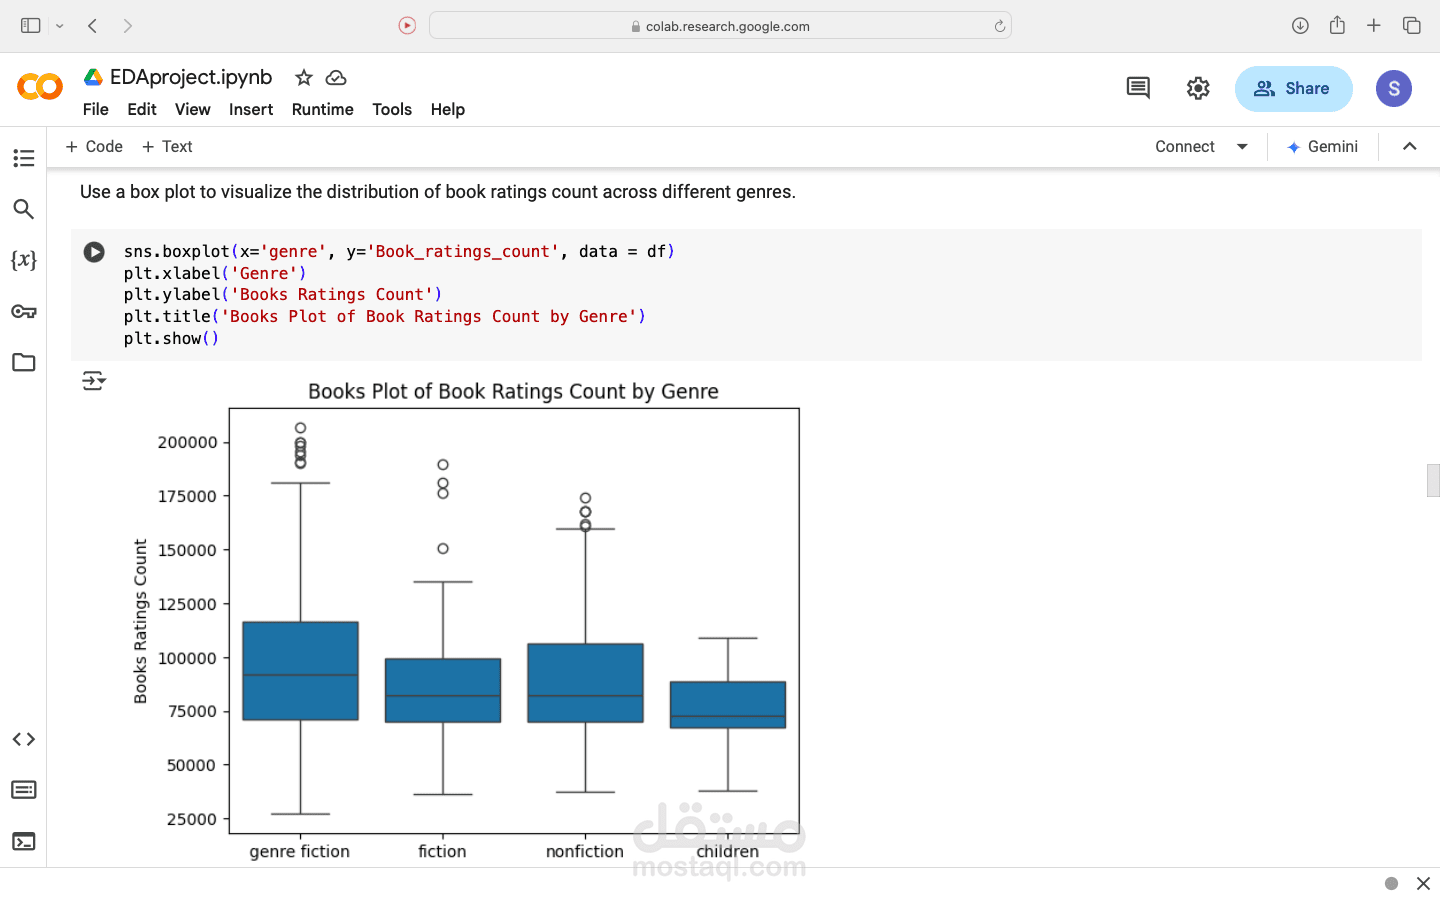
- Genre analysis
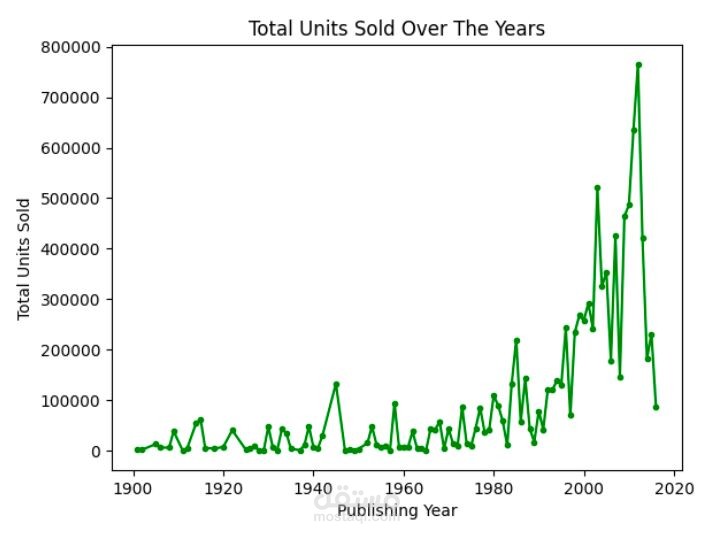
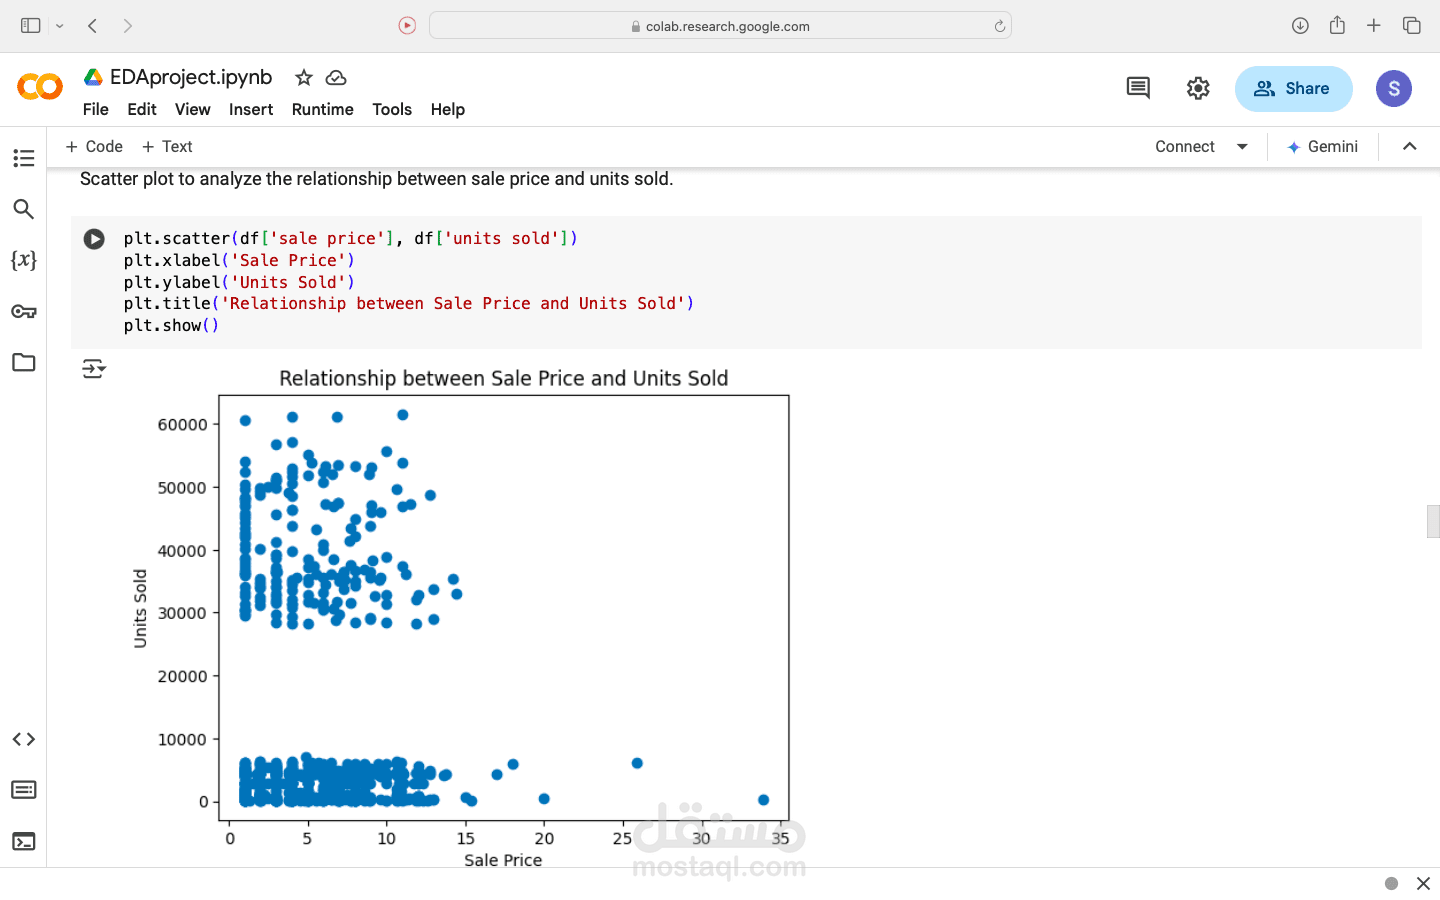
- Relationship between sale price and units sold
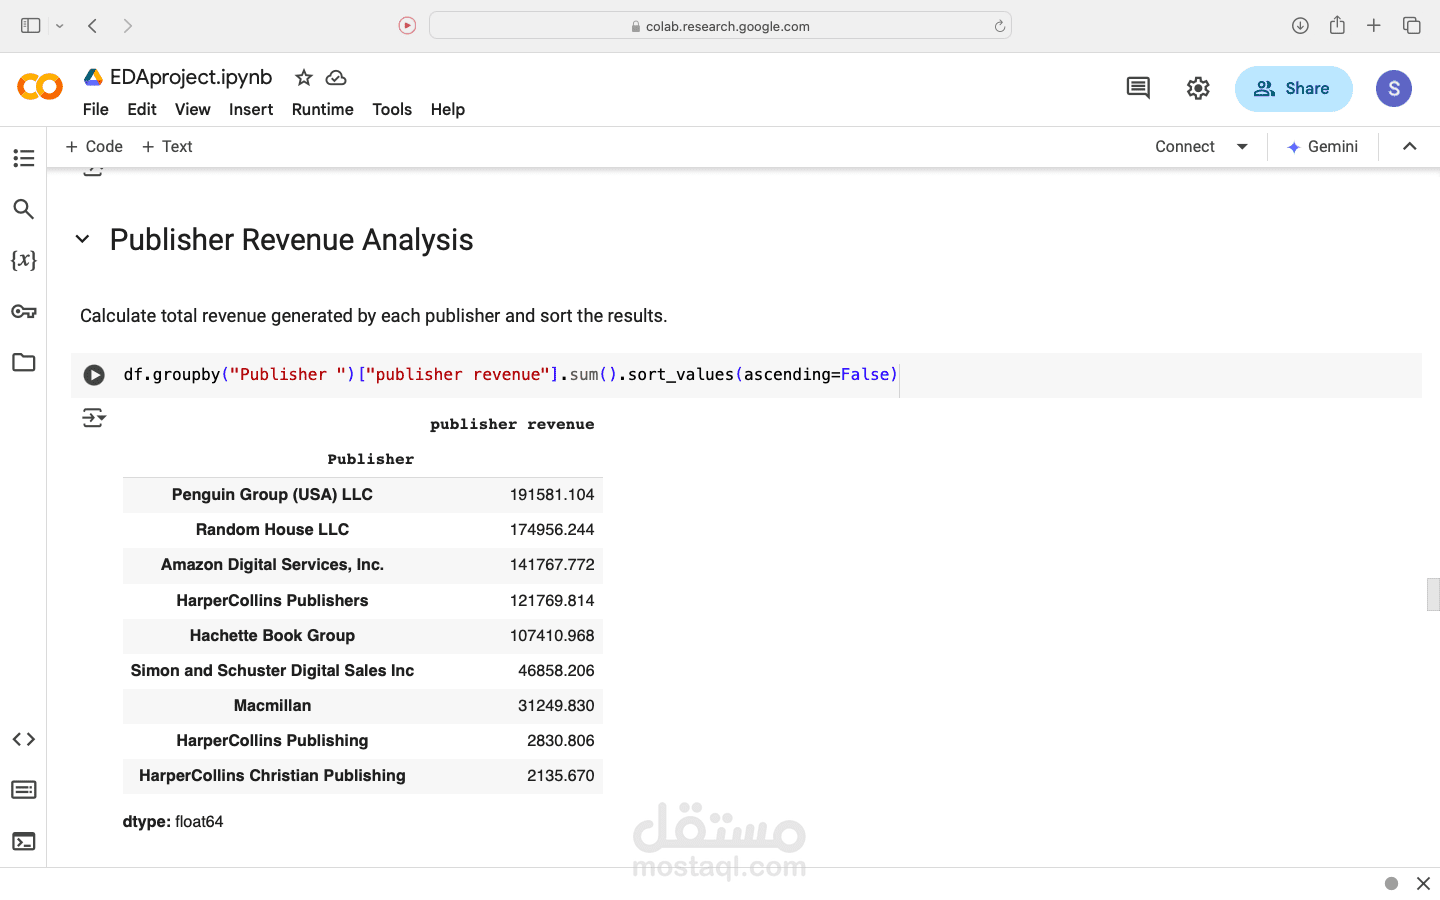
- Total gross sales by author
Key Findings:
Here are some interesting insights from my analysis:
- The majority of books were published after 2000.
- Fiction is the most popular genre, with the highest number of books.
- There is a positive correlation between book average ratings and the number of ratings received.
Visualizations:
I created several visualizations to illustrate my findings, including:
- Histograms for the distribution of publishing years
- Bar plots for genre counts
- Scatter plots to analyze relationships between variables
️ Technologies Used:
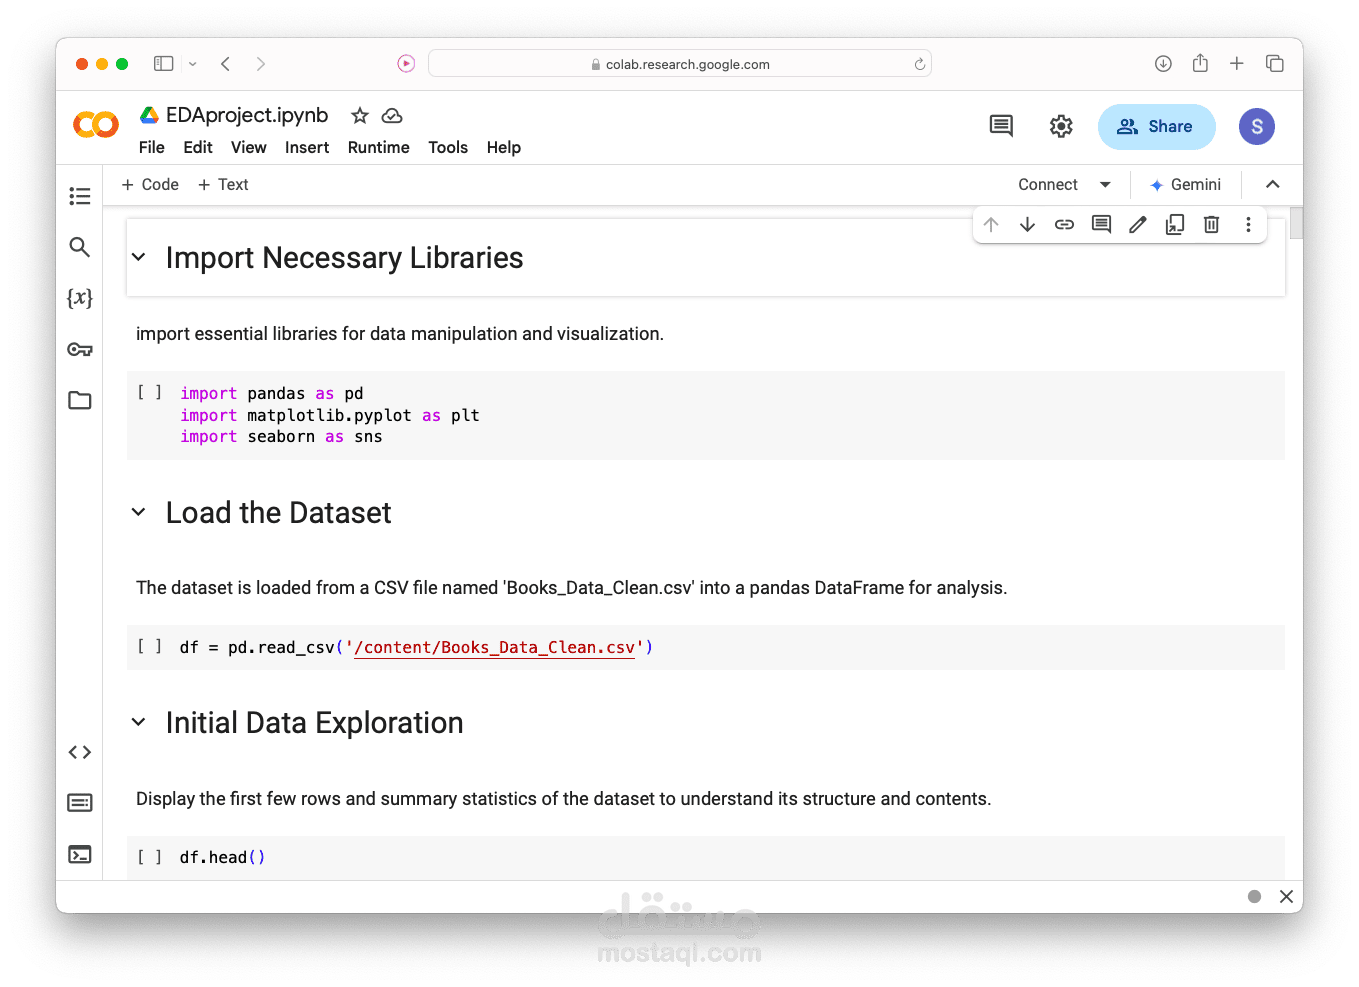
For this project, I utilized:
- Python with libraries such as Pandas, Matplotlib, and Seaborn for data manipulation and visualization.