Distribution of Item Types Using Python – Data Visualization & Analysis
تفاصيل العمل
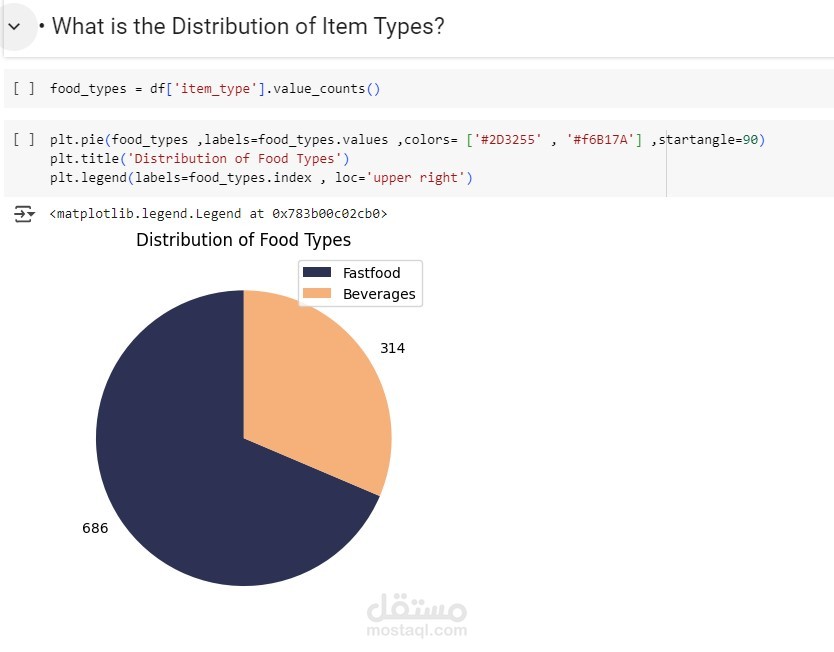
I have created a Python-based data visualization to analyze the distribution of item types, providing clear insights through graphical representation. Using powerful libraries like Pandas, Matplotlib, and Seaborn, this project helps in identifying trends and patterns effectively.
Key Features:
Data processing & cleaning
Distribution analysis with visual charts
Customizable graphs (bar plots, histograms, etc.)
Clear & professional presentation
If you need custom data analysis, visualization, or automation, I’m here to help