Data professional survey BreakDown
تفاصيل العمل
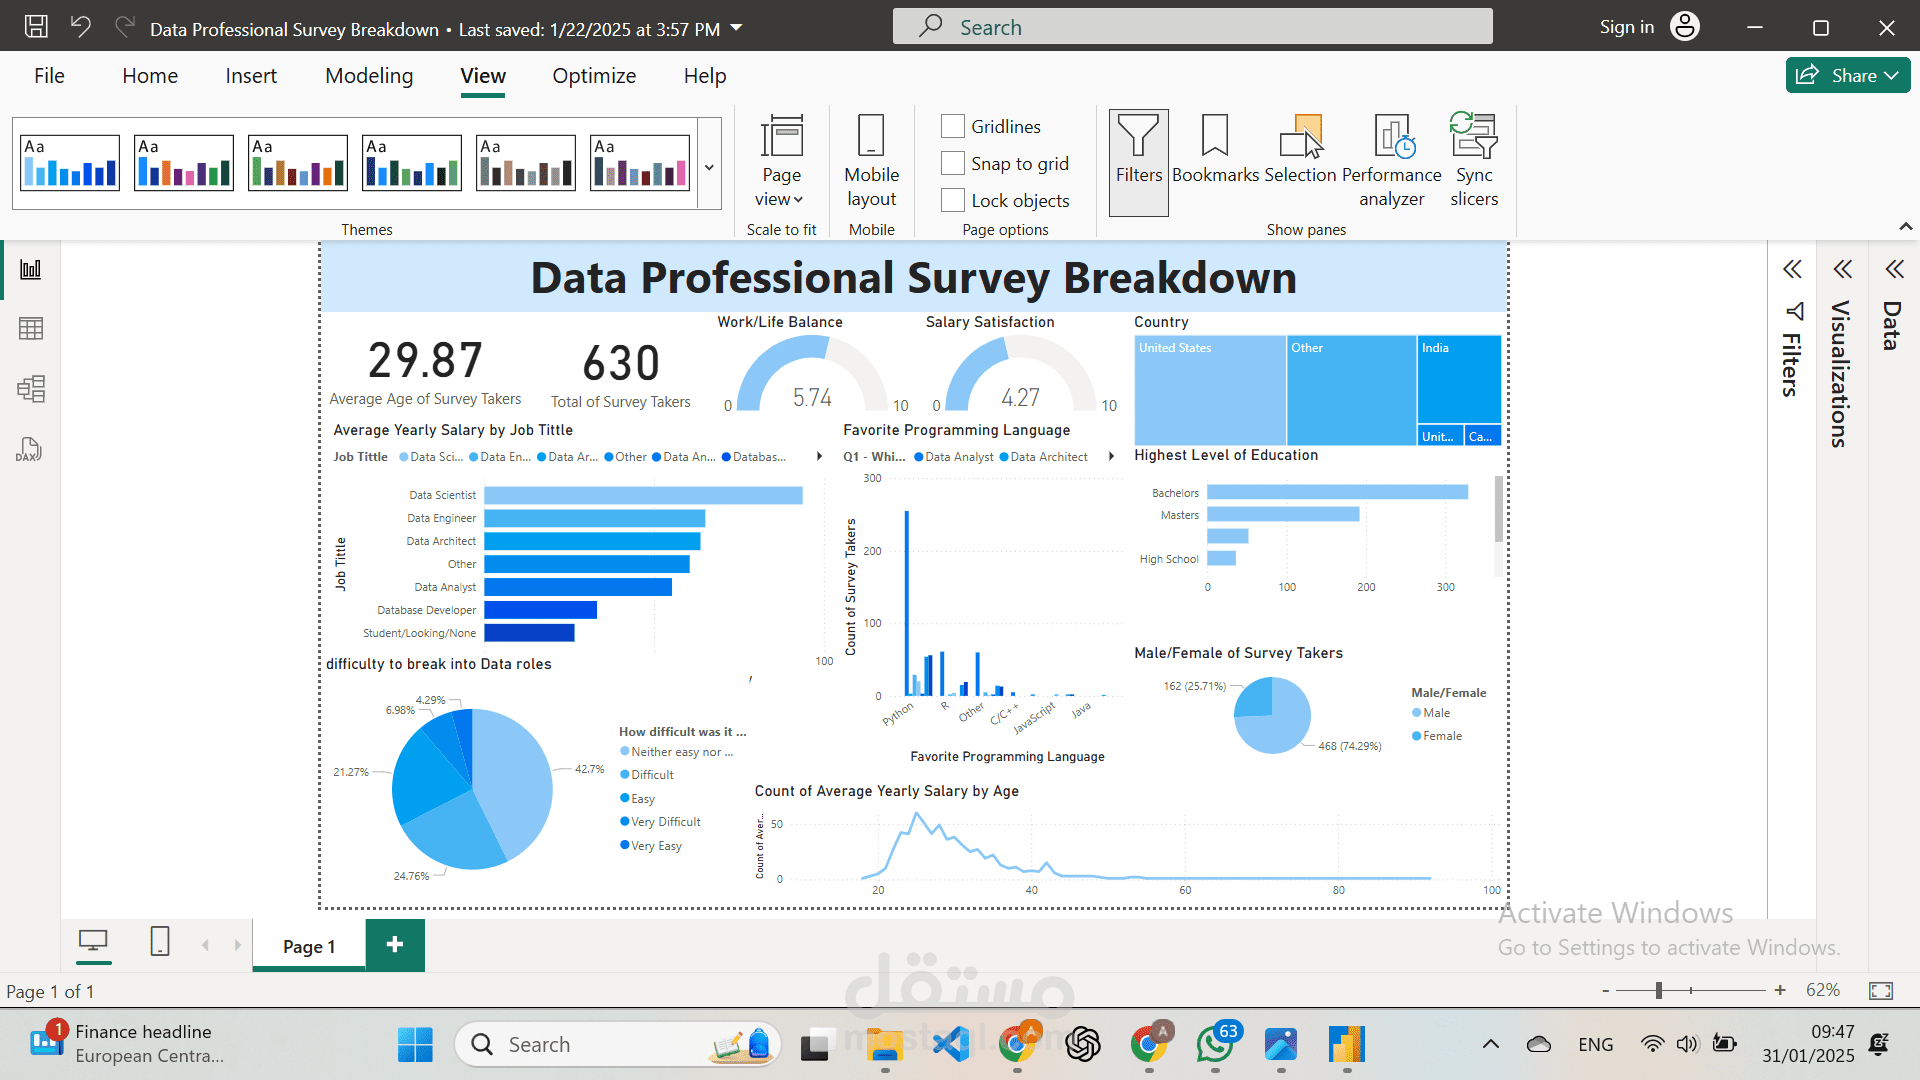
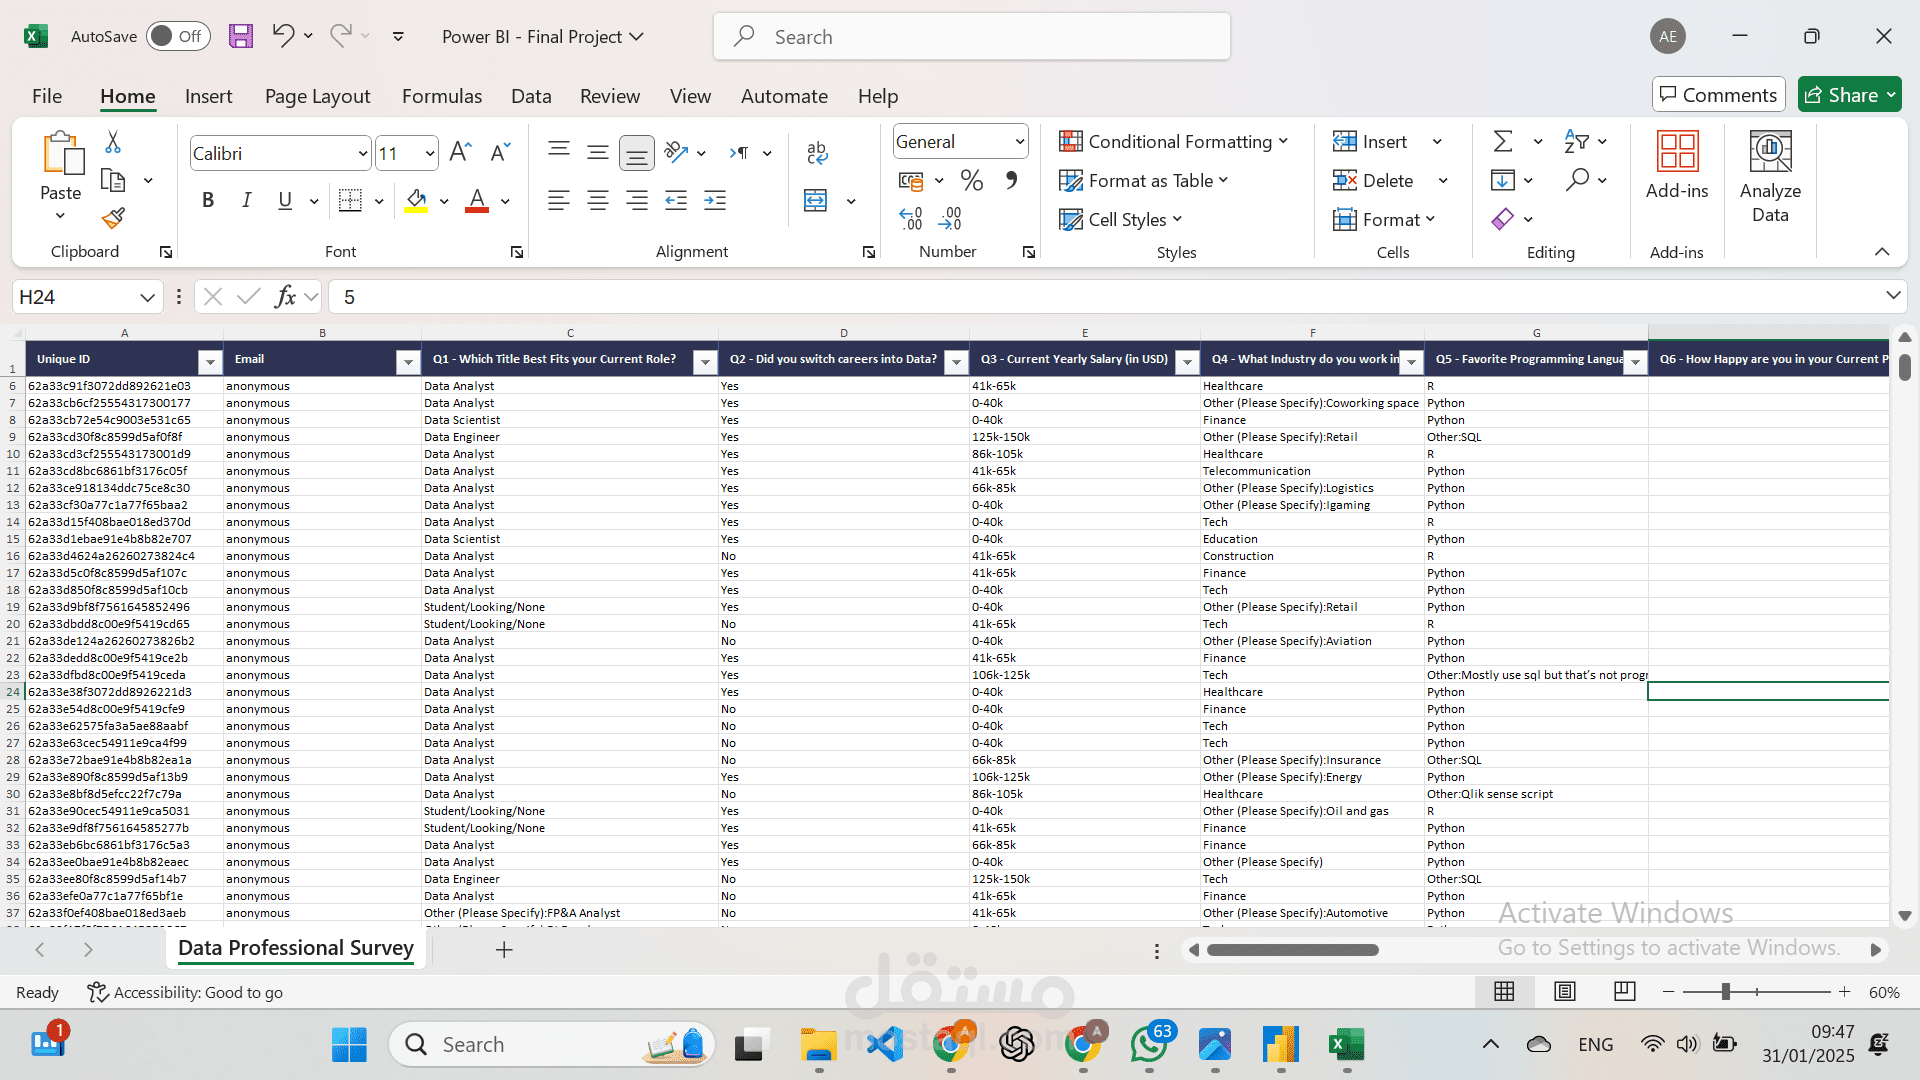
Cleaning and visualizing real data collected from a Twitter survey involves removing irrelevant, incomplete, or duplicate entries, and ensuring the data is properly formatted. Once cleaned, the data is organized for analysis. Visualization tools like charts and graphs are then used to highlight trends, patterns, and insights, making the data easier to interpret and understand. This process helps turn raw survey responses into actionable information.