Comprehensive Sales Analysis Dashboard
تفاصيل العمل
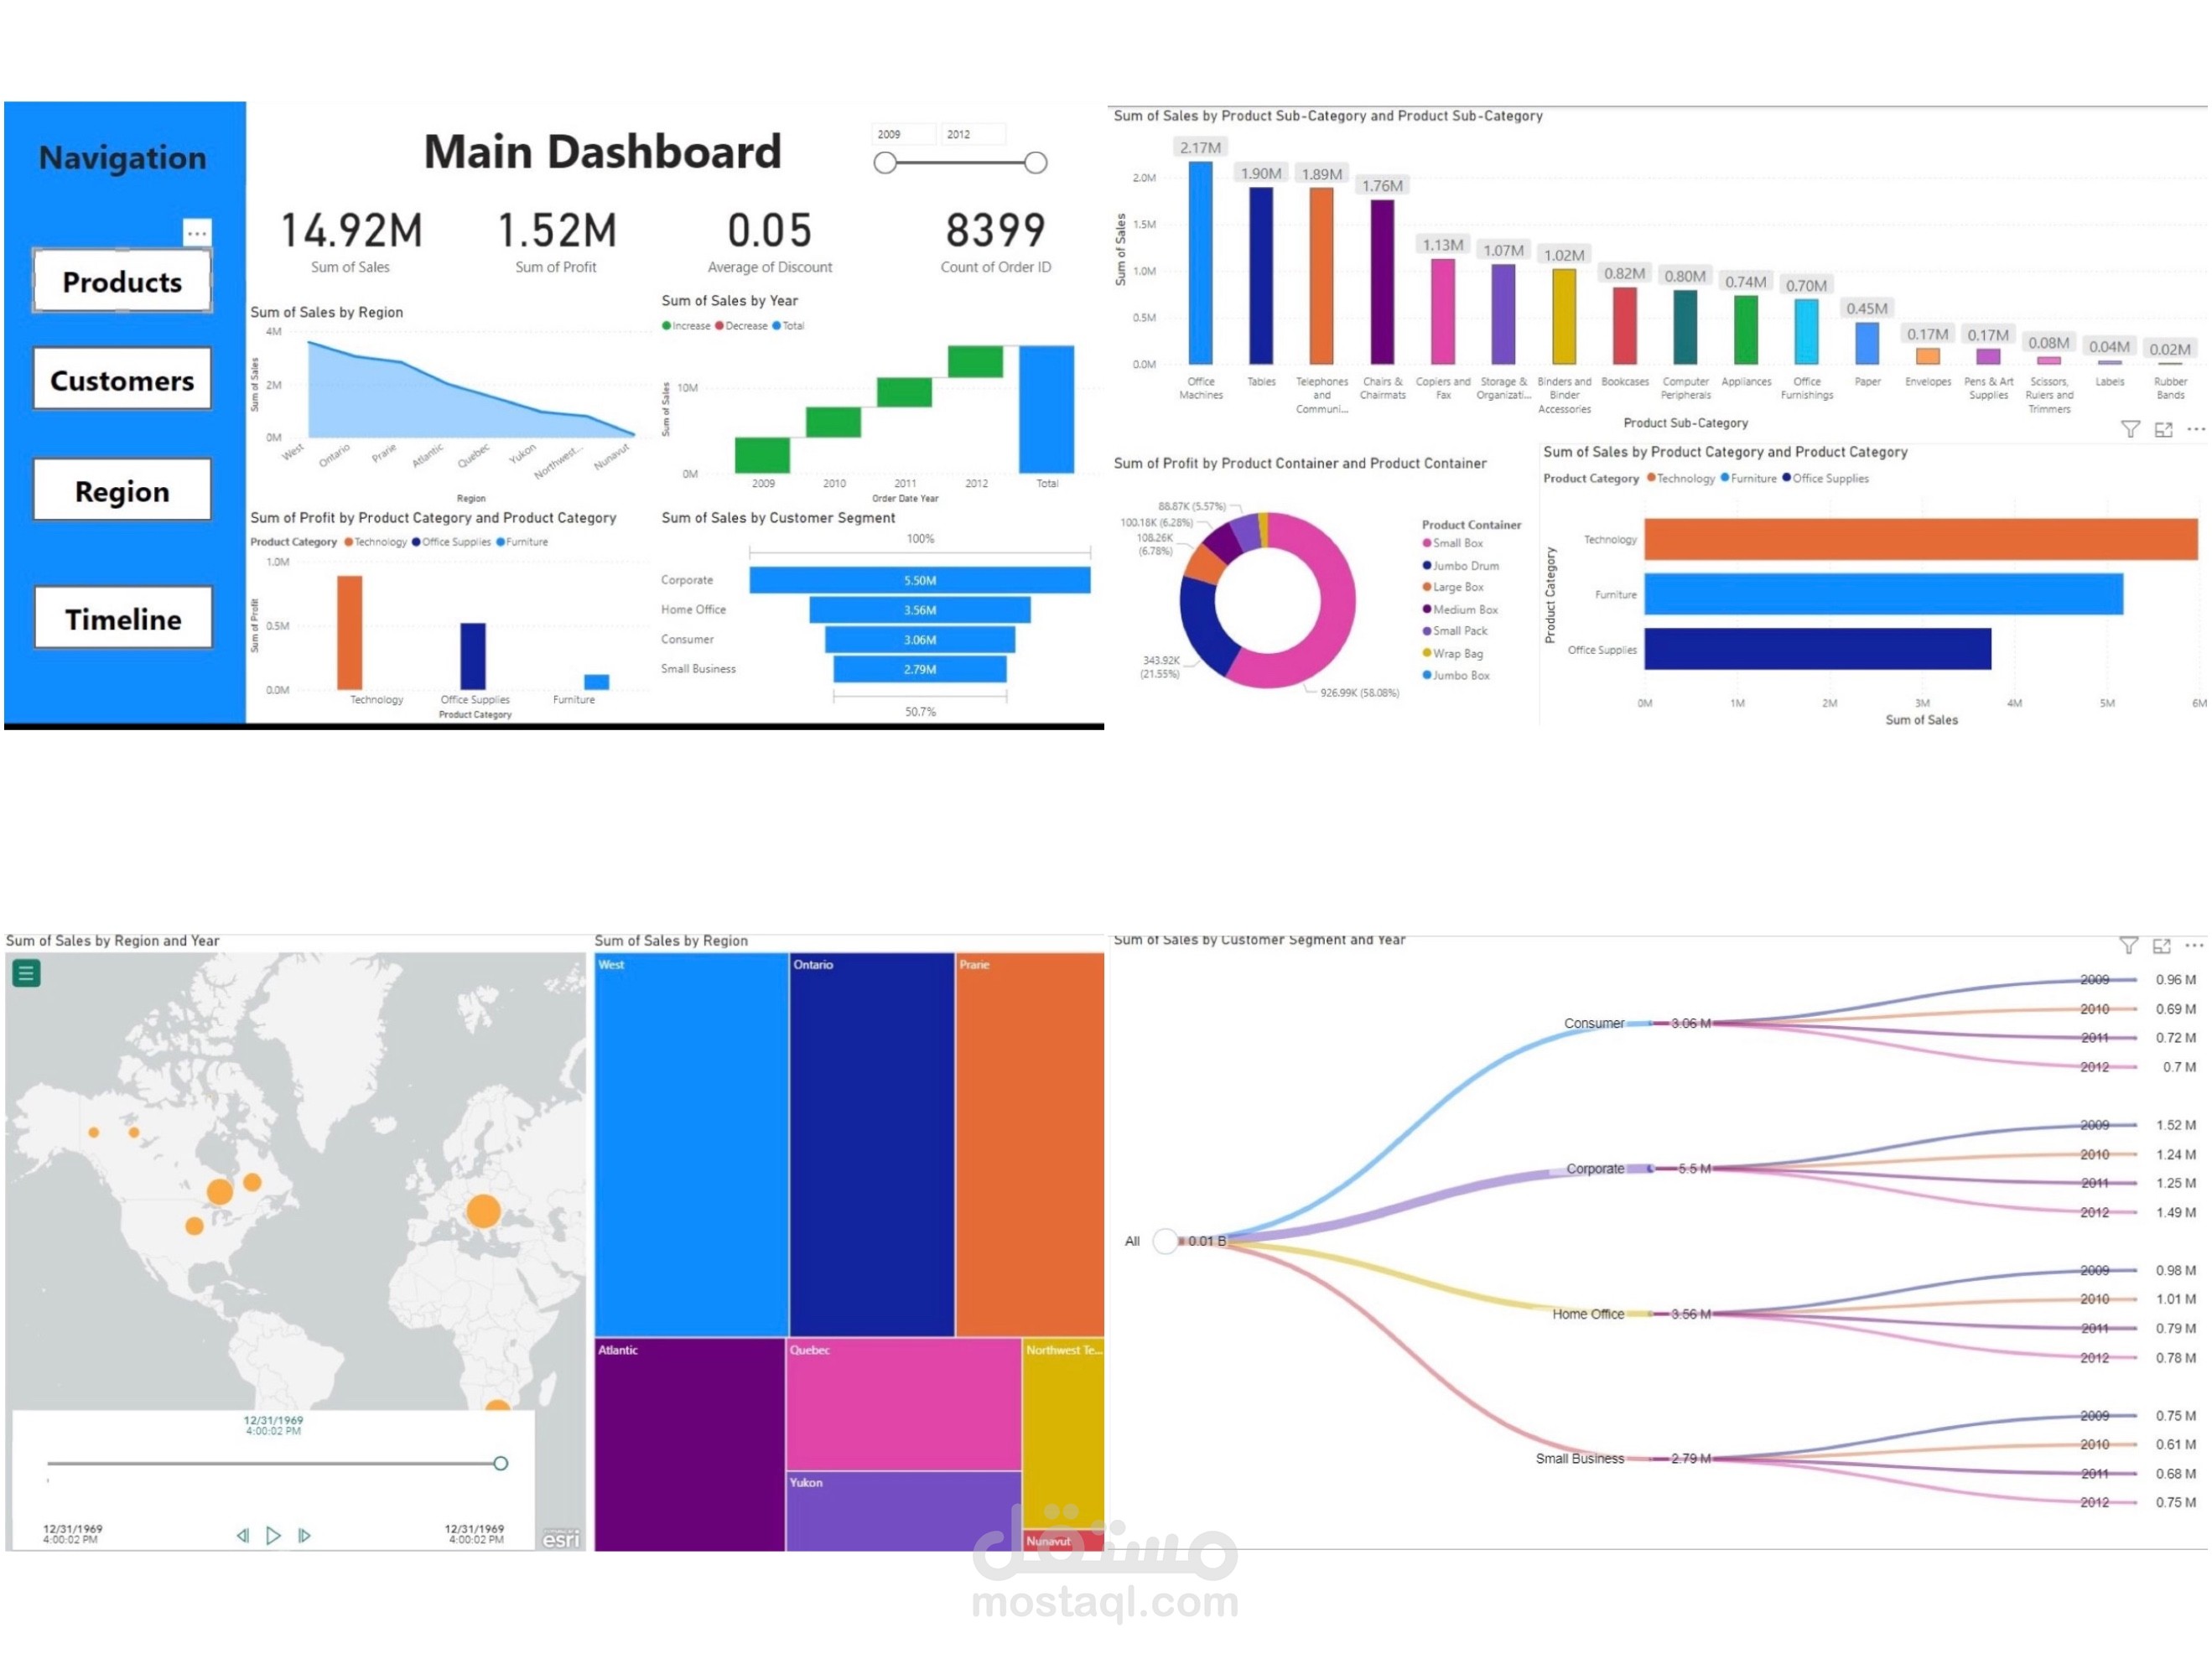
This interactive dashboard was developed to provide a holistic overview of sales performance, customer segmentation, product profitability, and regional trends. Key features include:
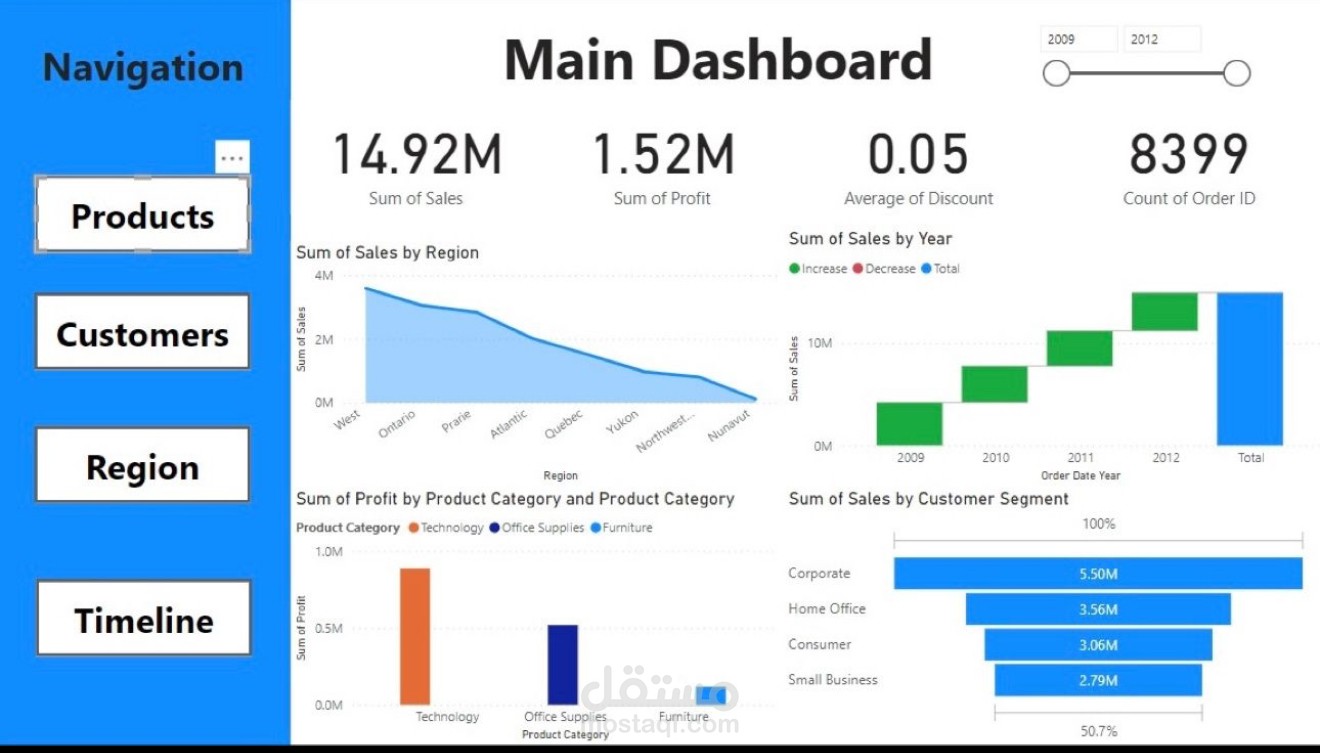
1.Main Dashboard Overview:
•Metrics such as total sales, total profit, and average order value displayed for quick insights.
•Interactive visualizations for sales trends, customer segments, and product categories.
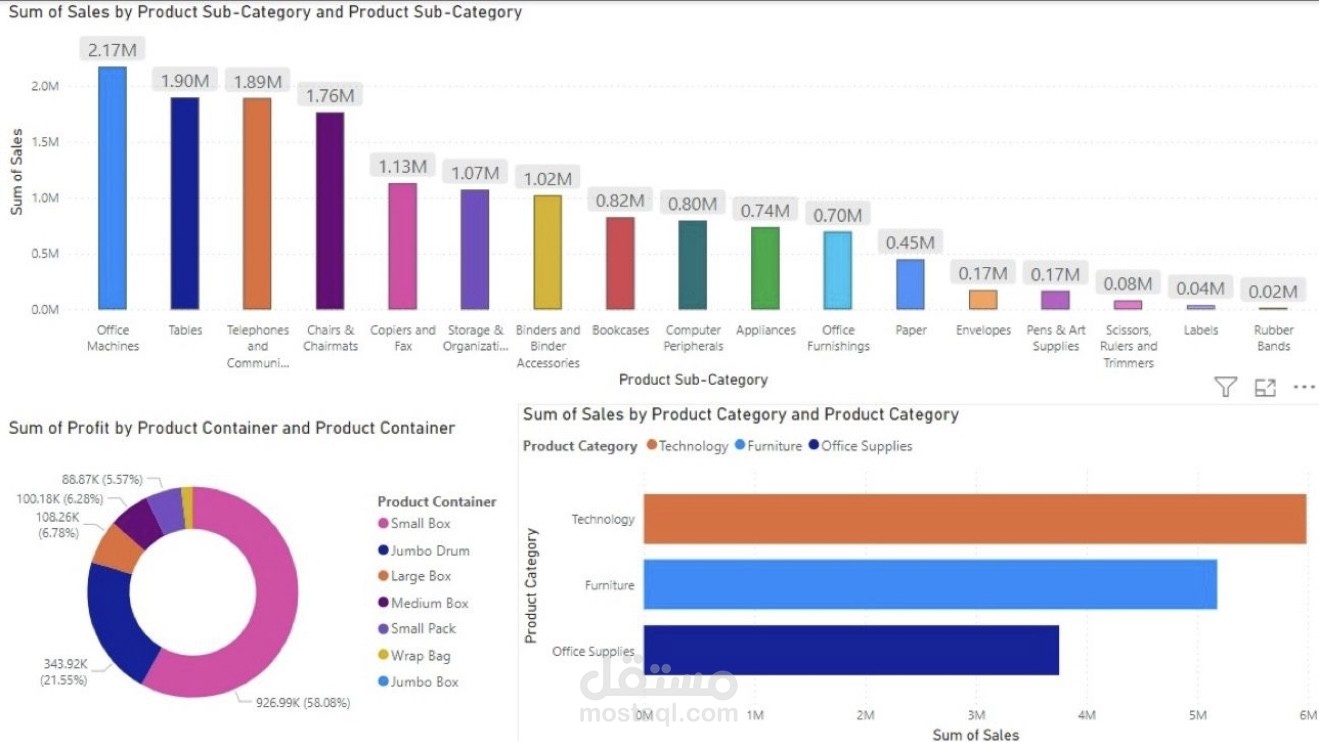
2.Product and Customer Insights:
•Drill-down analysis of sales by product sub-category and profit contribution by product container.
•Profitability comparisons across product categories such as Technology, Furniture, and Office Supplies.
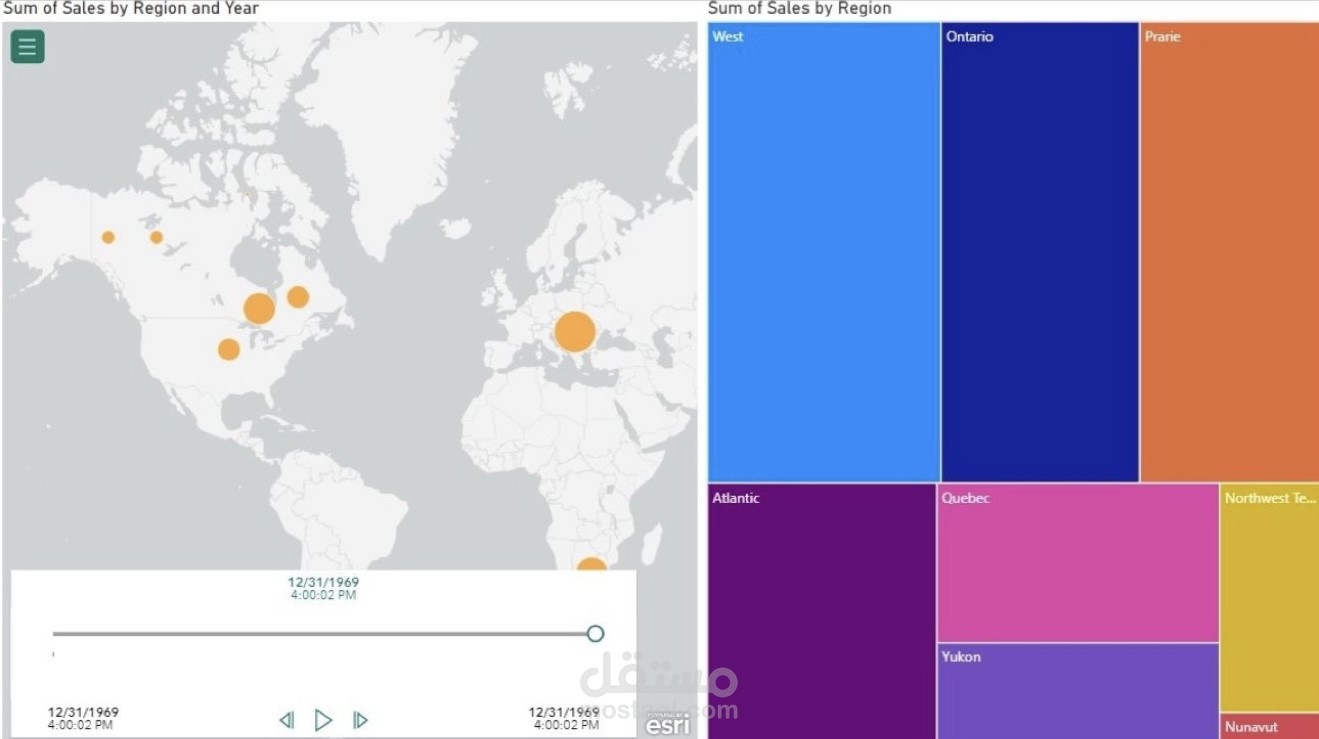
3.Regional and Timeline Analysis:
•Geo-map visualization of sales performance by region and year.
•Treemap of sales contribution by region to identify high-performing locations.
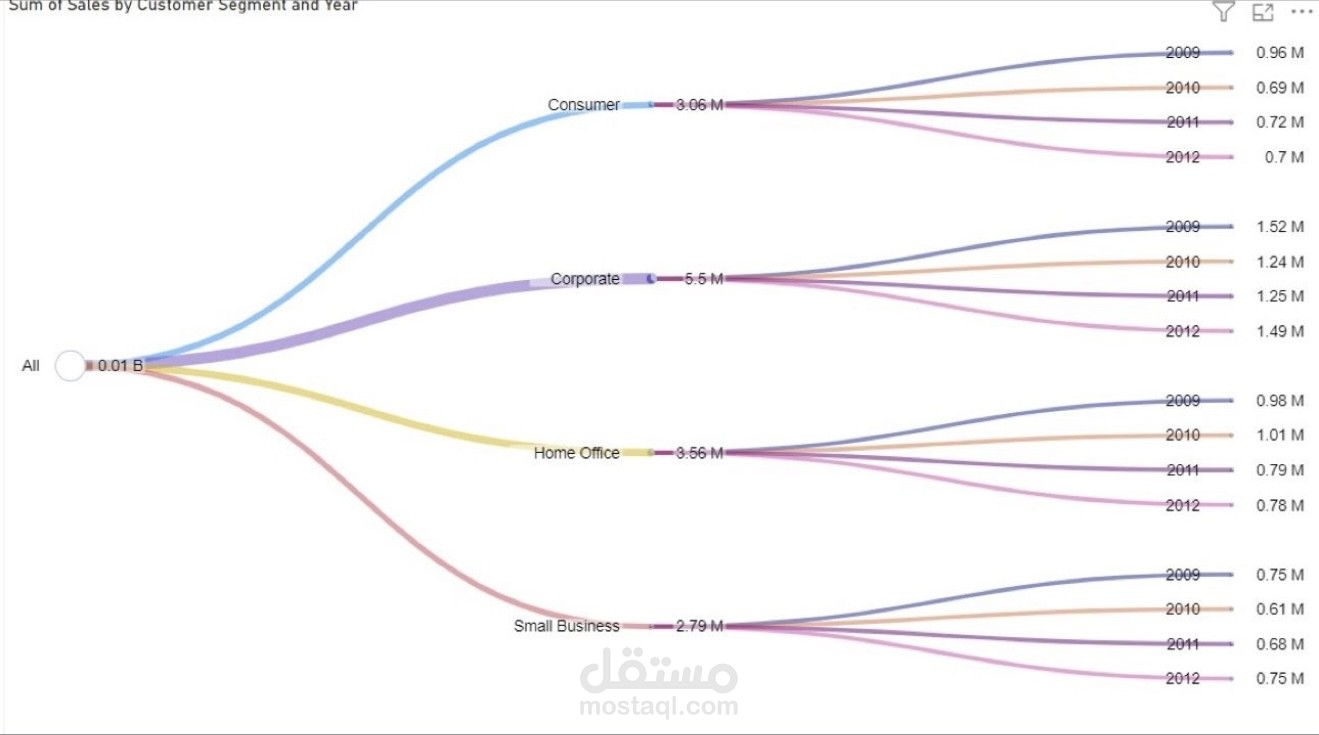
4.Sankey Diagram:
•Flow analysis of sales distribution across customer segments over multiple years.
Impact for the Client:
•Enhanced Decision-Making: The dashboard allowed the client to identify key trends and pinpoint underperforming regions or products.
•Optimized Sales Strategies: Insights from customer segments and product performance helped tailor marketing efforts and promotional strategies.
•Increased Efficiency: The navigation panel streamlined data access, enabling teams to focus on actionable insights without needing complex queries.
•Data-Driven Growth: Leveraged insights to align business strategies with market demands, leading to better resource allocation and improved sales performance.