zara sales dashboard
تفاصيل العمل
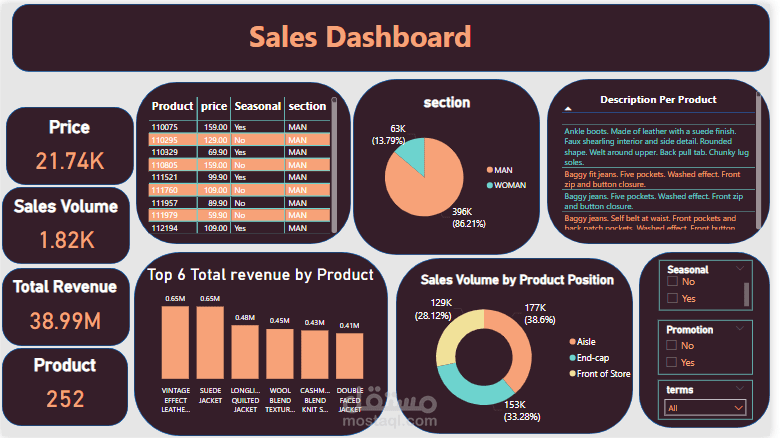
Sales Dashboard Design and Development
I created an advanced Sales Dashboard that provides in-depth insights into sales performance, product trends, and customer behavior. This project was designed to assist decision-makers in analyzing key metrics and optimizing business strategies.
Dashboard Features:
Key Metrics Overview: Price, Sales Volume, Total Revenue, and Number of Products.
Segmentation: Detailed breakdown by gender (Men vs. Women), seasonal trends, and product positions (Aisle, End-cap, Front of Store).
Top Products Analysis: Identification of the top-performing products based on revenue.
Interactive Filters: Easy-to-use filters for seasonal and promotional analysis.
Data Visualization: Clear and visually appealing graphs and tables for quick insights.
Tools Used:
Power BI for data visualization and dashboard development.
Focus on clean design and user-friendly navigation for better decision-making.
This project showcases my expertise in data analysis, visualization, and business intelligence tools, making it ideal for businesses looking to gain actionable insights from their data.
If you're looking for a custom dashboard tailored to your needs, feel free to reach out!