Sales and Revenue Data Visualization
تفاصيل العمل
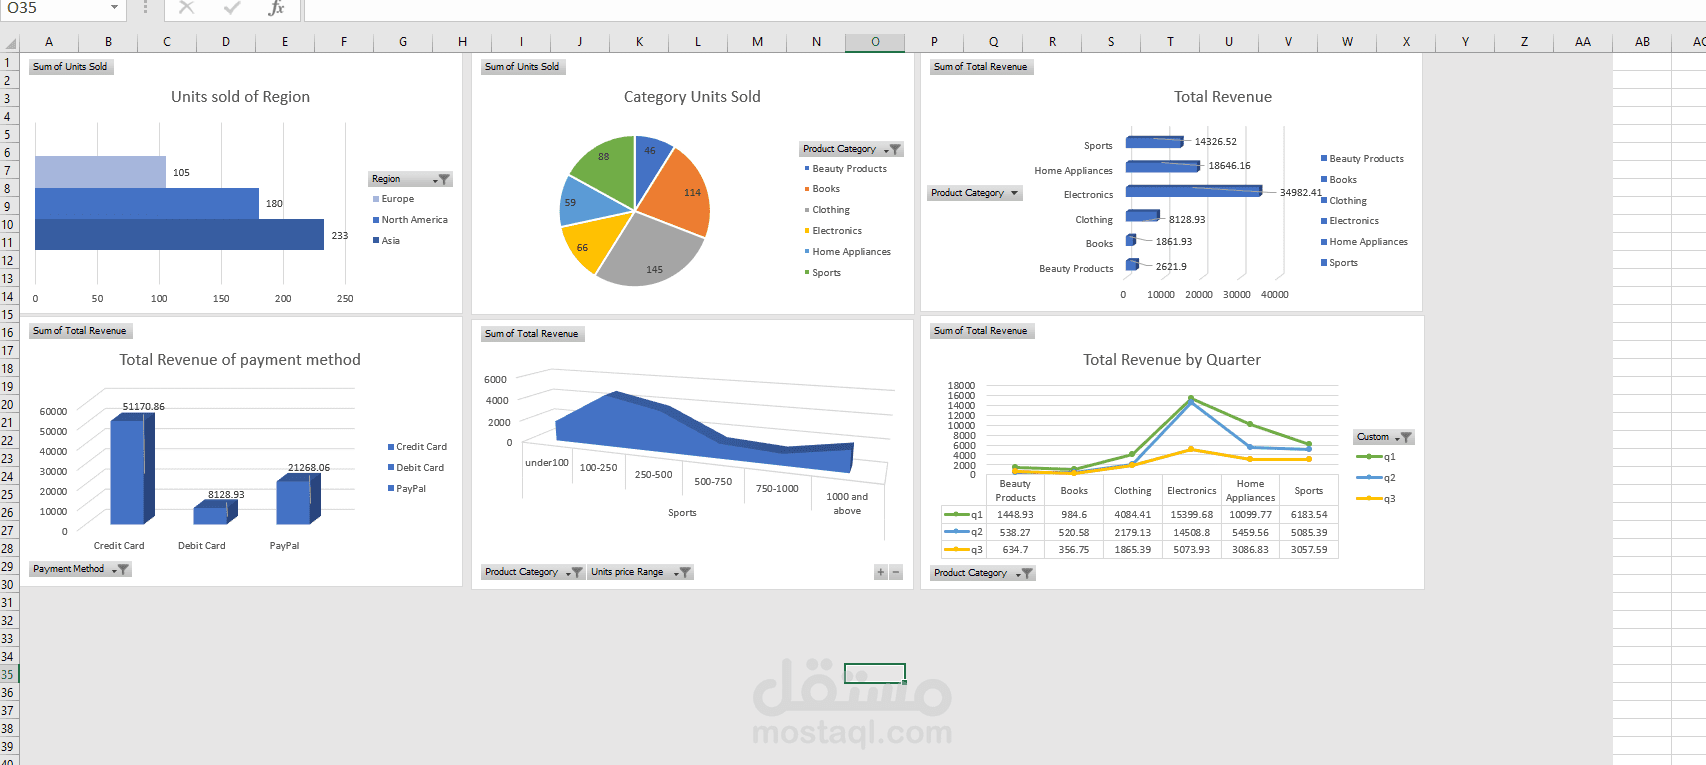
This image showcases multiple data visualizations, including bar charts, pie charts, and line graphs, to analyze sales performance. The charts illustrate regional sales distribution, revenue by product category and payment method, and revenue trends by quarter.