Sales Performance Dashboard Insights
تفاصيل العمل
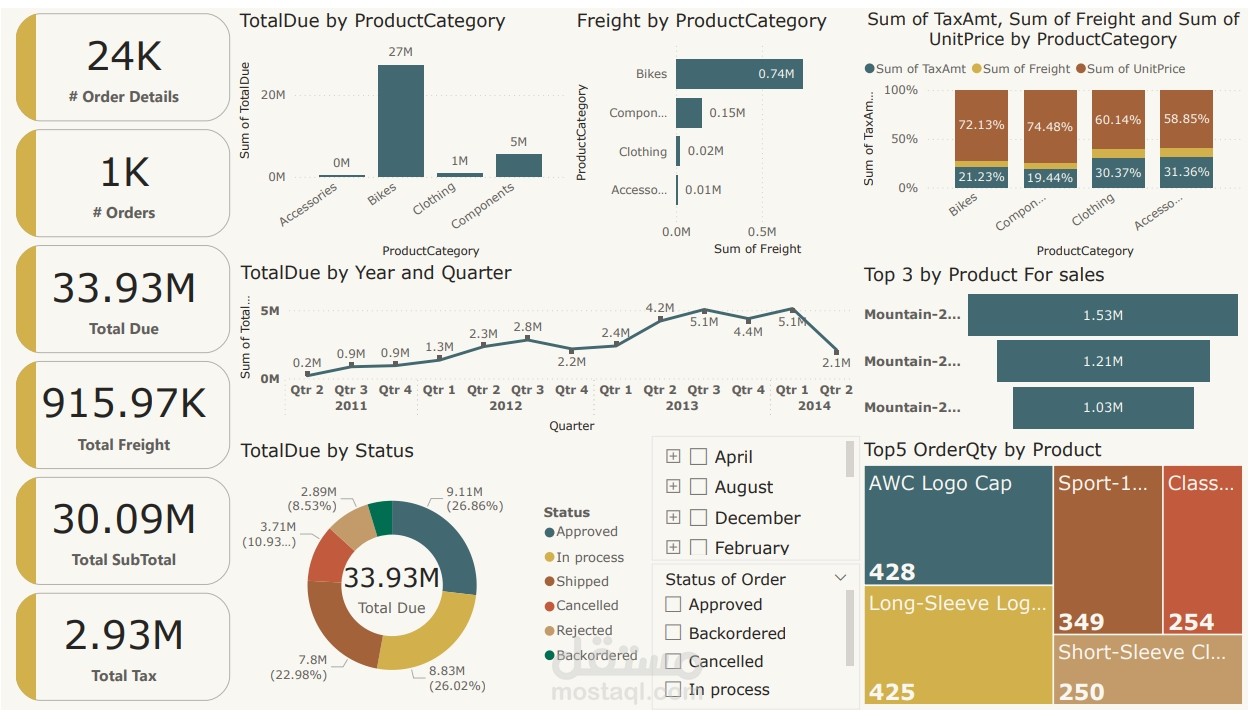
This dashboard visualizes key sales metrics, providing a comprehensive overview of order details, product categories, and financials.
Key Highlights:
Total Orders: 1K+ orders contributing to over $33.93M Total Due ️
Top Selling Products: Mountain bikes lead the way, driving more than $1.5M in sales. ️
Product Categories: Bikes dominate sales with $27M in total due, while clothing and accessories follow.
Freight & Taxes: Freight costs and tax breakdowns are mapped by product category, providing a full picture of logistics costs.
Order Status: Visualized in a detailed breakdown of approved, in-process, and shipped orders, with real-time tracking of backorders and cancellations.
Using this dashboard, stakeholders can easily identify top products, monitor sales trends, and track performance by month and status, enabling data-driven decision-making.