Cookies Dashboard Overview
تفاصيل العمل

Cookies Dashboard Overview
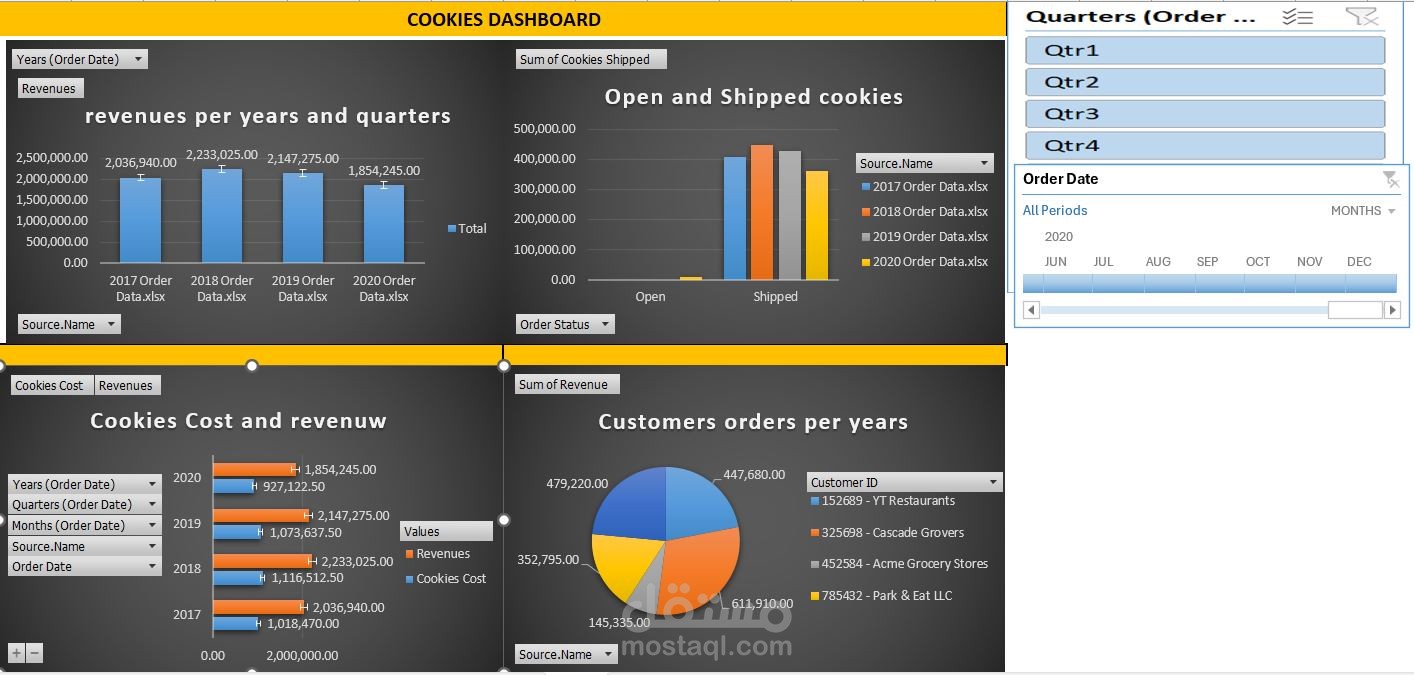
This Cookies Dashboard provides an in-depth analysis of the performance of cookie-related sales and operations over multiple years. The dashboard is designed to offer key insights into revenues, costs, shipment statuses, and customer orders in an interactive and visually appealing format.
Key Features and Insights
Revenues Over Time:
A bar chart displays total revenues from 2017 to 2020, highlighting yearly trends and allowing for easy comparison of sales performance over time.
Open and Shipped Cookies:
The status of cookie orders is shown in a column chart, categorizing them as Open or Shipped.
This helps in understanding operational efficiency and customer fulfillment rates across the years.
Cookies Cost and Revenue Analysis:
A comparative bar chart demonstrates the relationship between cookie costs and revenues for each year.
This visualization highlights profit margins and cost trends over the years, enabling strategic decision-making.
Customer Orders by Year:
A pie chart breaks down revenue contributions by key customers, such as "YT Restaurants," "Cascade Grovers," "Acme Grocery Stores," and others.
This information can be used to identify top customers and strategize customer relationship management.
Interactive Time Filters:
The dashboard includes slicers for filtering data by Years, Quarters, and Months of order dates.
These filters empower users to drill down into specific time periods for a more granular view of performance.
Interactive Elements
Order Date Selector: Enables filtering of data by year, quarter, or month to tailor the view as needed.
Order Status Filter: Allows users to focus on either open or shipped cookie orders for operational insights.
Benefits
Offers a clear and concise view of the revenue and cost dynamics over multiple years.
Provides insights into shipment statuses and operational efficiency.
Helps identify top-performing customers, ensuring targeted marketing and relationship-building strategies.
Enhances data exploration with interactive filters for customized analysis.