Sales dashboard
تفاصيل العمل
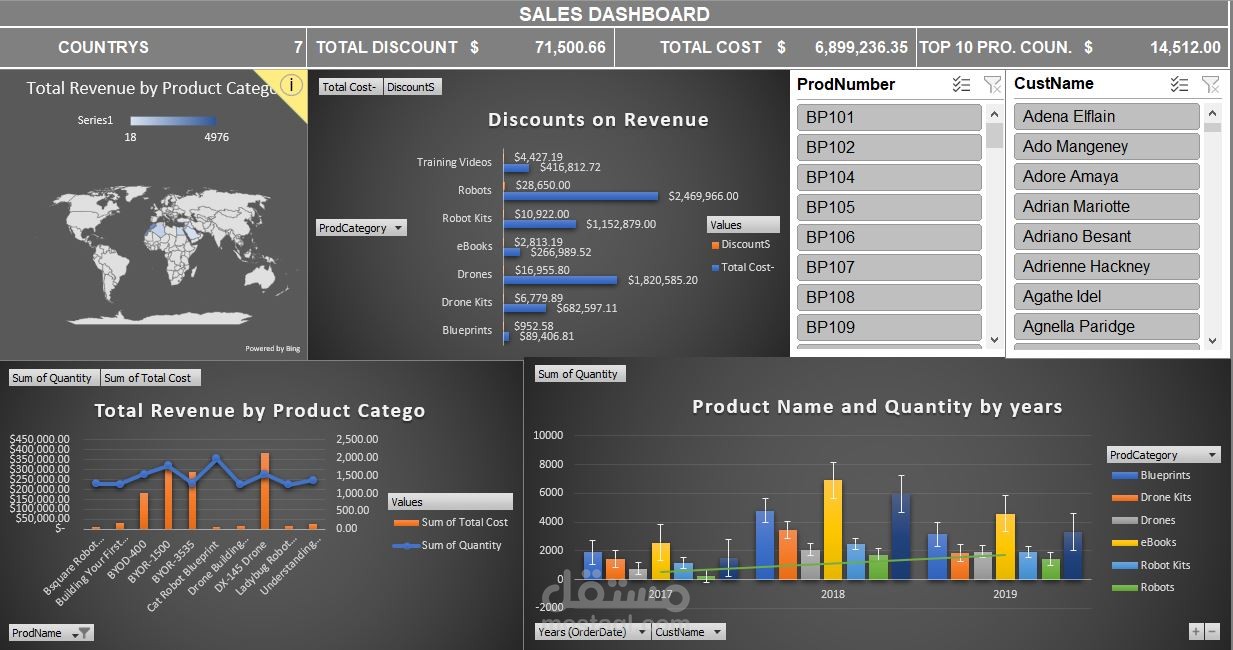

Sales Dashboard Overview
This interactive Sales Dashboard provides a comprehensive overview of the company's sales performance across multiple dimensions. It is designed to facilitate data-driven decision-making and insights into revenue generation, product performance, and customer behavior. Below are the key features and insights presented in the dashboard:
Key Metrics
Countries Covered: A total of 7 countries are included in the analysis.
Total Discounts: $71,500.66, representing the cumulative discounts offered.
Total Cost: $6,899,236.35, reflecting the overall cost associated with the sales.
Top 10 Producing Countries Revenue: $14,512.00, highlighting revenue contribution from the top-performing regions.
Visual Insights
Global Revenue Distribution:
A geographical heat map powered by Bing displays total revenue by country, allowing a clear visualization of sales distribution across regions.
Revenue by Product Category:
A detailed breakdown of revenue generated by different product categories such as Robots, Drones, eBooks, and others.
Both total revenue and associated costs are visualized for a comparative analysis.
Discounts on Revenue:
A bar chart shows the total discounts and costs for each product category, providing a clear understanding of how discounts impact overall profitability.
Customer and Product Insights:
Filters are available for product numbers and customer names, enabling granular exploration of data.
Yearly Product Performance:
A clustered column chart shows product quantity sold across years (2017–2019), categorized by product type. This offers insights into sales trends over time.
Product Revenue and Cost Analysis:
A dual-axis line chart illustrates the relationship between total revenue and total cost by product categories, helping to identify profitable and underperforming items.
Interactive Features
Dynamic slicers for filtering data by product category, customer name, and product number.
Multi-level insights allow users to drill down into specific segments for more detailed analysis.
Benefits
Provides a holistic view of sales performance, from product-specific insights to geographical revenue distribution.
Supports strategic decision-making by highlighting key areas of revenue generation and cost optimization.
Enables real-time, interactive data exploration to uncover actionable insights.