Covid 19 data analysis
تفاصيل العمل
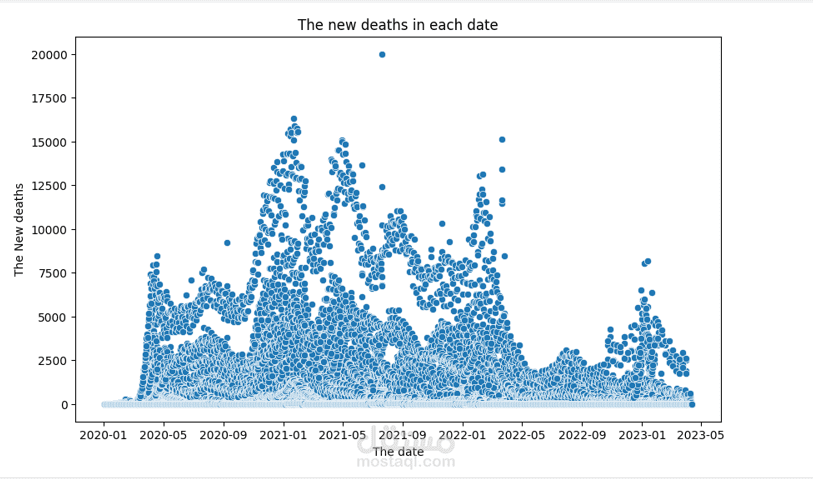
This project involves analyzing COVID-19 data to uncover trends, patterns, and insights. It includes data preprocessing, visualization, and statistical analysis of key metrics such as infection rates, recovery rates, and mortality rates. The project aims to identify regional variations, trends over time, and the impact of interventions. It uses tools like Python, Pandas, seaborn and Matplotlib to create meaningful visualizations and support data-driven decision-making.