Female Survey
تفاصيل العمل
Female Survey Dashboard Description
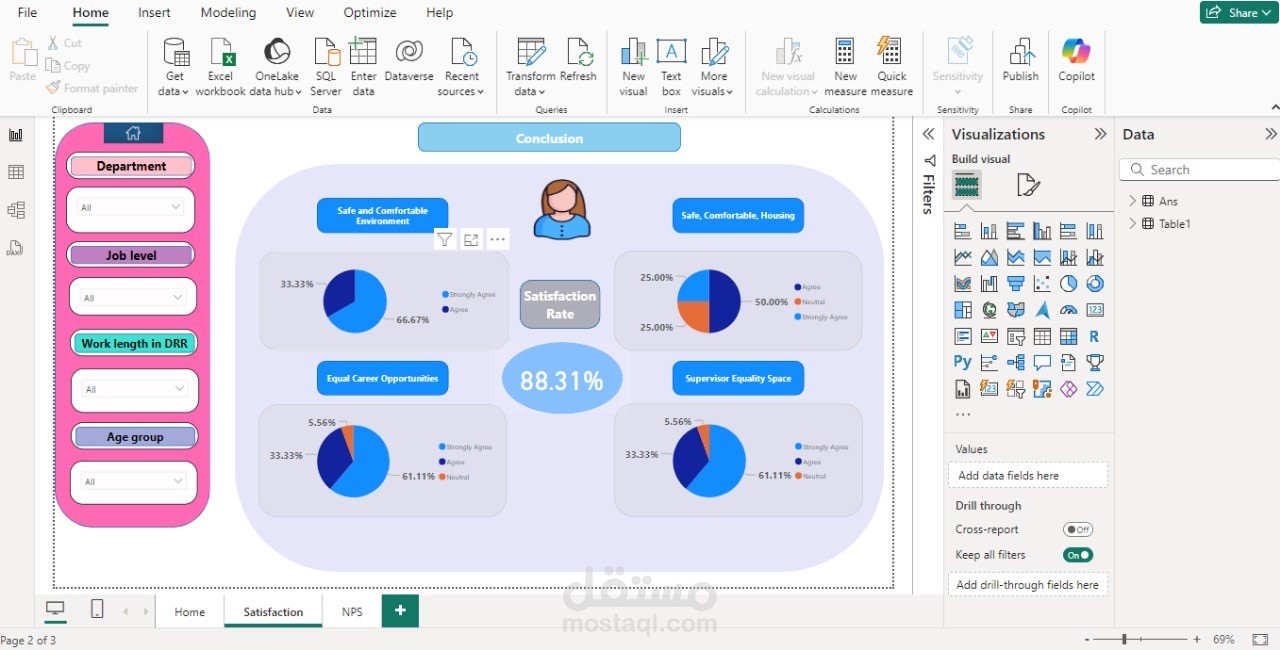
Page 1: Overview
• Focus: This provides a summary of the respondents’ characteristics and their distribution in the population.
• Key Elements:
• Demographics Visuals:
• Years of service: Pie chart that further classifies the respondents into groups depending on how long they have served in their organisations.
• Age: Pie chart that illustrates the age brackets of the respondent: (20-25, 26-31 etc.)
• Job Position: Pie chart representing the participants on a scale of employee, B and C etc.
• Enabling Functions: Filter department on top, on the left hand side of the top corner.
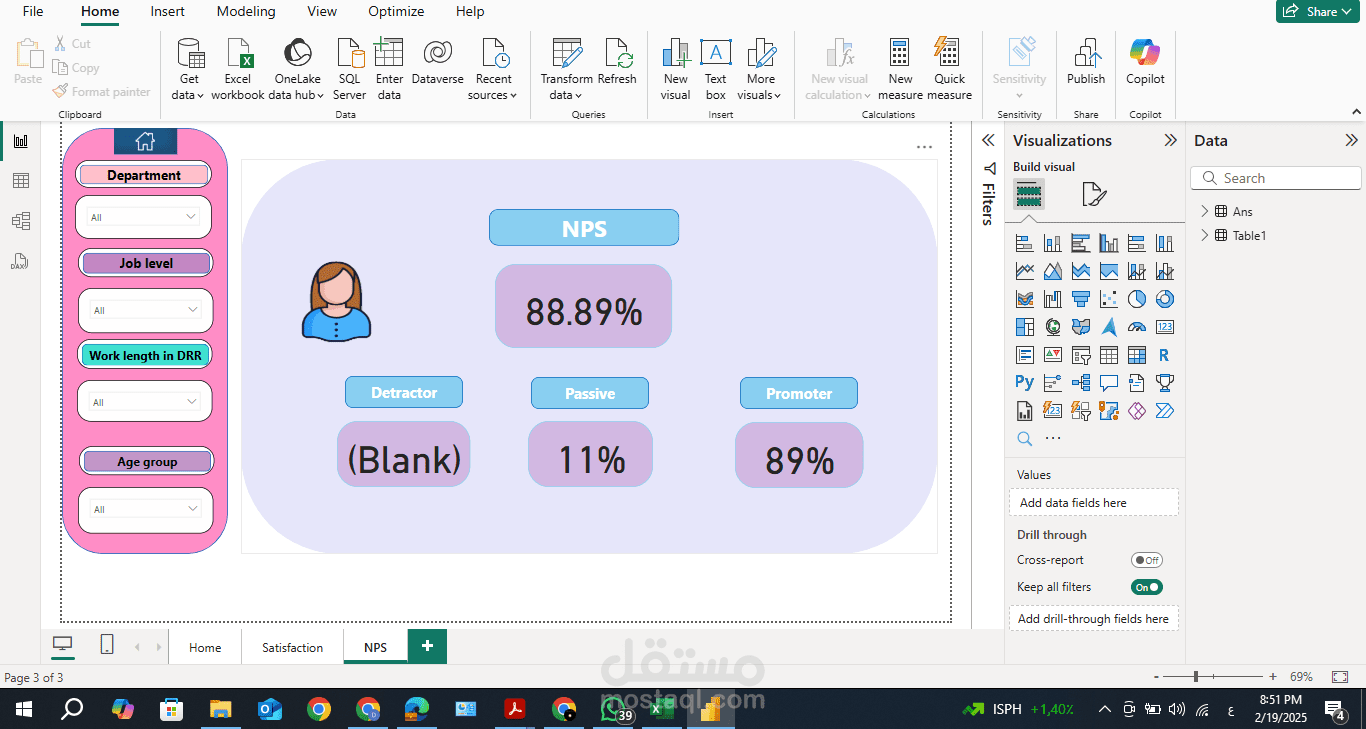
• Crusader Functions: Slation Buttons for Net Promoter Score (NPS) and Satisfaction targets
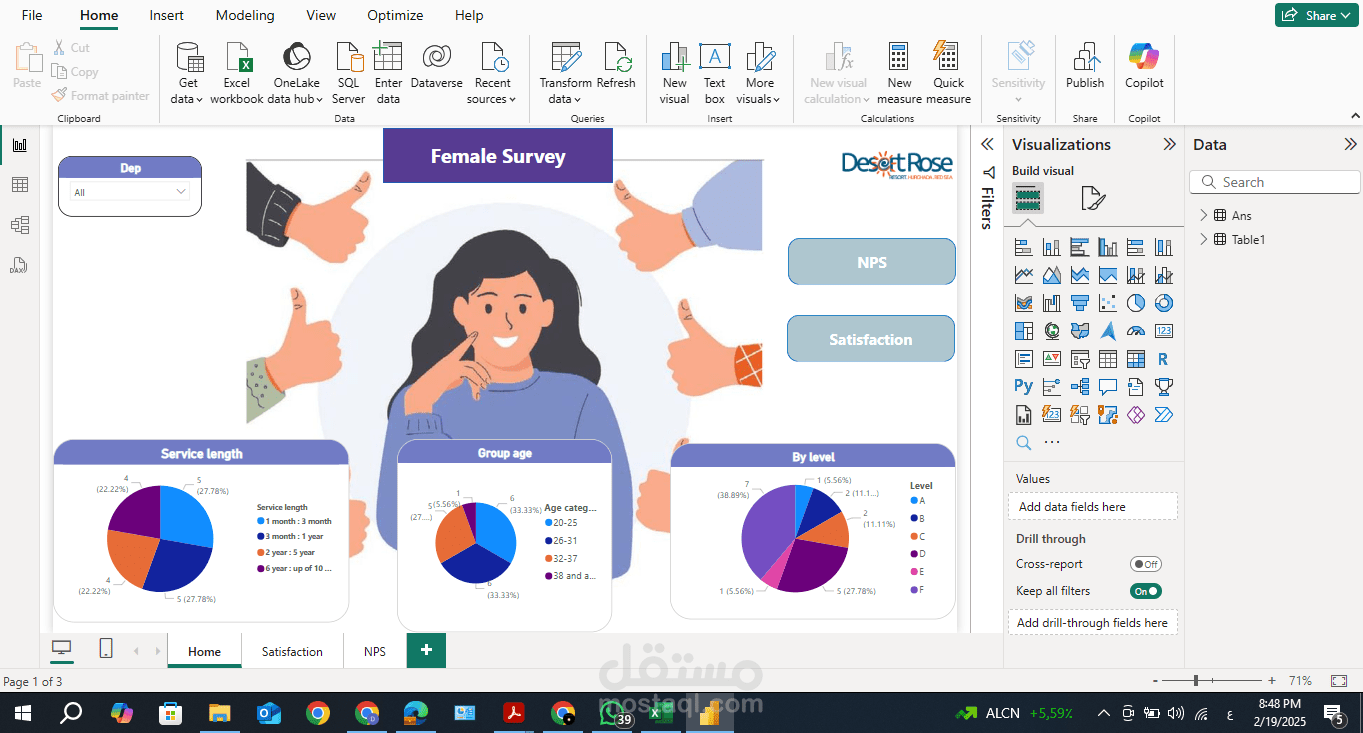
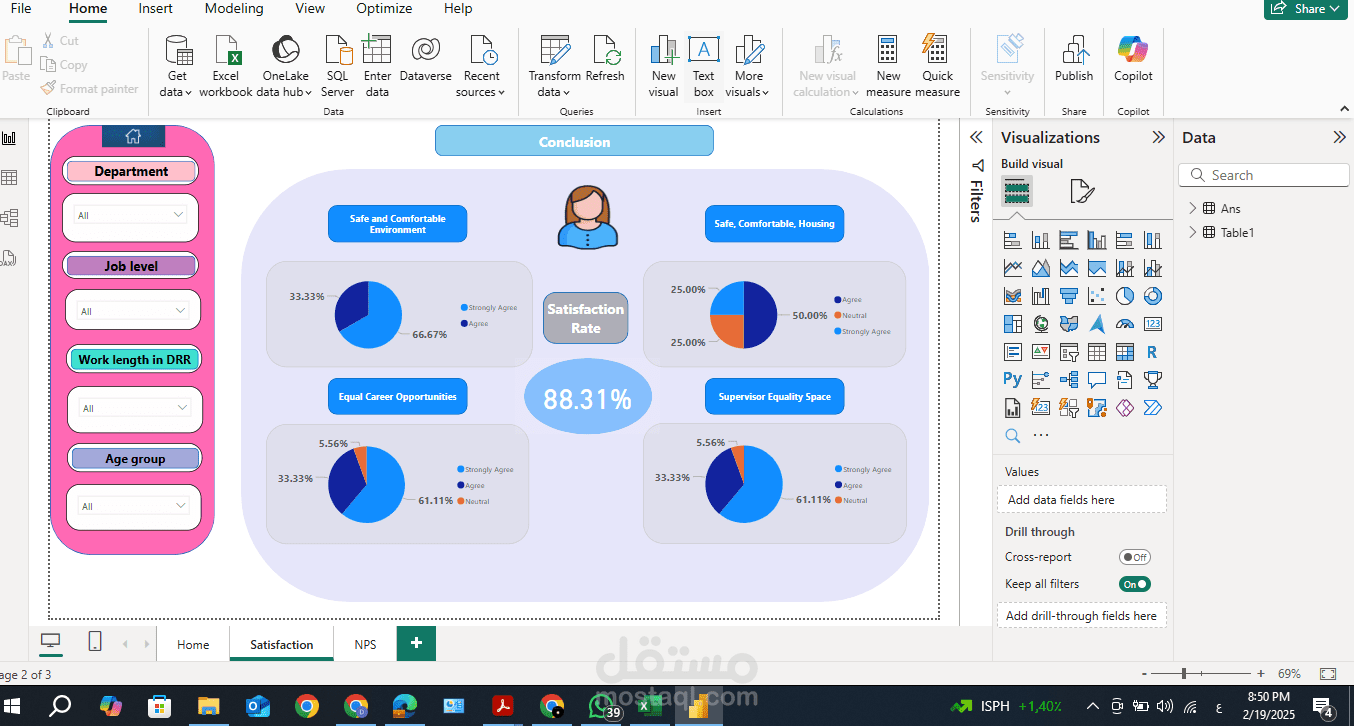
Page 2: Satisfaction Analysis
• Focus: Takes a closer look into the satisfaction levels of the female employees towards the company.
• Key Elements:
• Filters
• Select options in dropdowns maintaining the data by the department, the grade, duration of employment and the age group on the left side of the door.
• Metrics of Satisfaction:
• A Safe and Comfortable working environment vs A Safe and comfortable working environment: Pie charts illustrating the levels of agreement.
• Equal Career Opportunities vs Equal Career Opportunities: Disextent of agreement on equal scope and growth opportunities.