Sales analysis dashboard
تفاصيل العمل
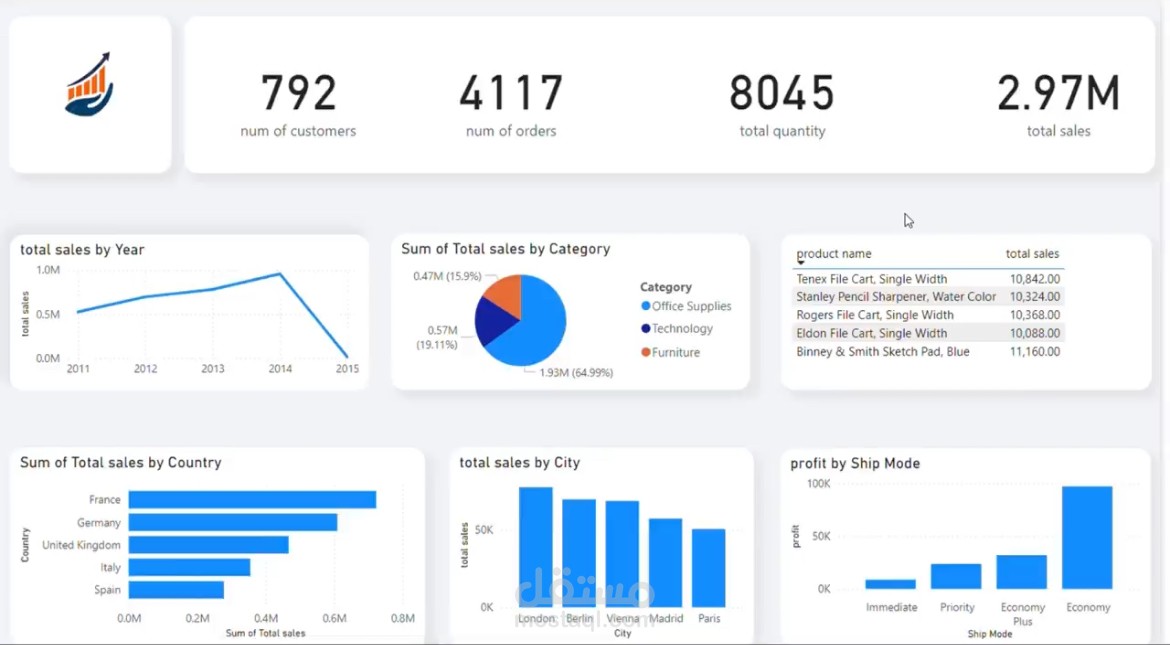
I’ve just completed a sales analysis dashboard that provides a comprehensive view of key performance metrics. Here's what it includes:
Key Insights:
Total number of customers: 792
Total number of orders: 4,117
Total sales quantity: 8,045
Total sales amount: $2.97M
Breakdown:
Sales by Year, showing growth and trends.
Sales by Category, with Furniture leading at 65%.
Top products by total sales.
Geographic distribution of sales by Country and City.
Profit margins by Shipping Mode, with Economy mode being the most profitable.
Data Structure:
Fact Table (Sales): Orders, Products, Categories, Discounts, Profits, and Quantities.
Dimension Tables: Product details, Customer details, Shipping Modes, Sub-Categories, and Geographic information (Countries and Cities)