تحليل بيانات لشركة decodelabs
تفاصيل العمل
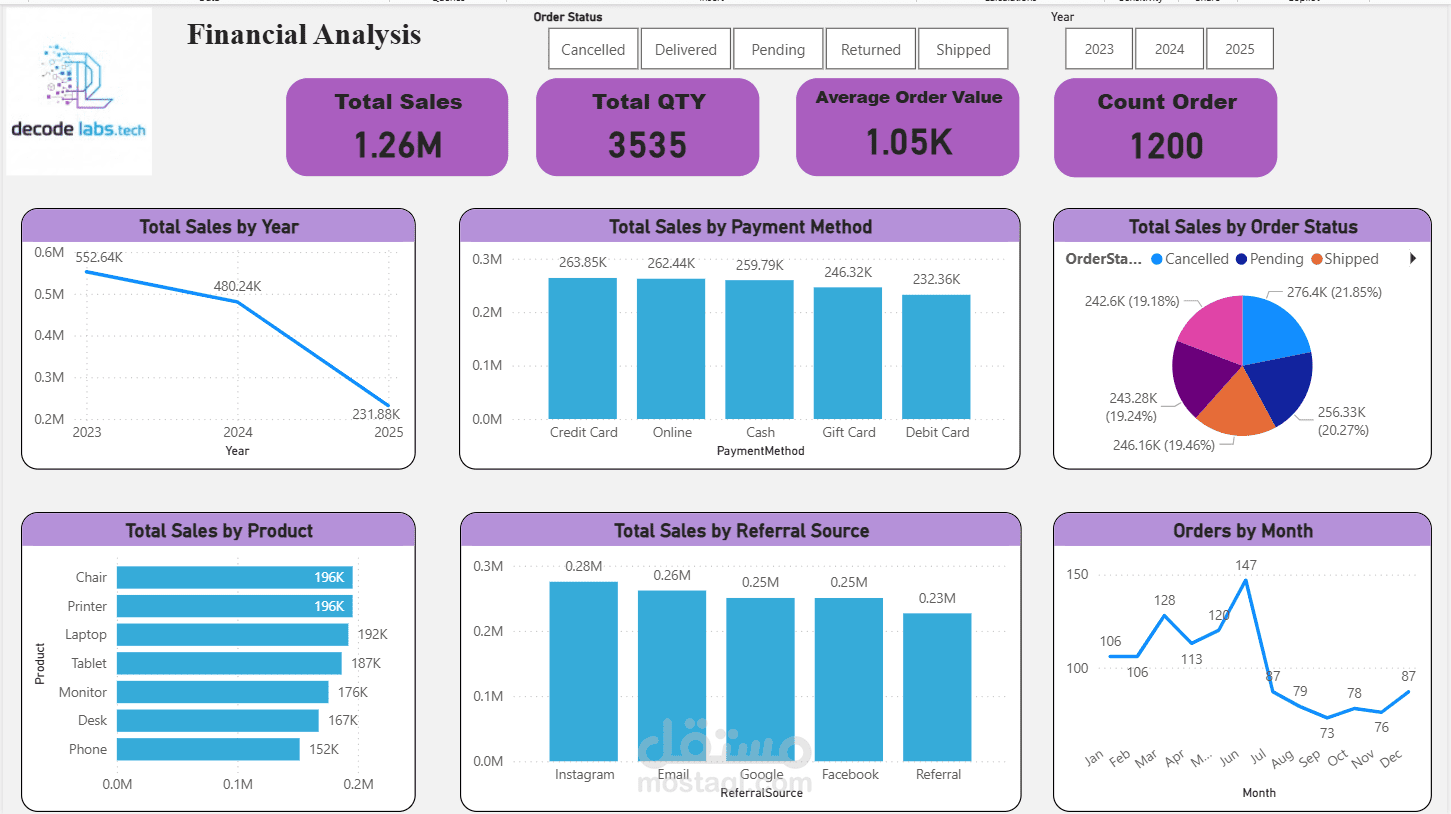
create dashboard for Decodelabs company
show all sales data by years and months and create bar chart - line chart that show trends
and add slicer to make our dashboard interactive and more dynamics