India Agricultural Analysis
تفاصيل العمل
*Problem Statement
This project aims to conduct a comprehensive analysis of Indian agriculture, focusing on district-wise and year-wise data. The dataset provides detailed information on various crops, their areas, production, and yields across different districts and years. The goal is to leverage Power BI to create interactive visualizations that uncover trends, patterns, and disparities in agricultural practices, enabling stakeholders to make informed decisions for sustainable farming and resource allocation.
*Data Overview
-The dataset encompasses a wide range of agricultural variables, including crop areas, production quantities, and yields for different crops such as rice, wheat, sorghum, millets, pulses, oilseeds, sugarcane, and more.
-The dataset is in a CSV format, it consists of 16146 rows and 80 columns. It contains the following columns
*Conclusion
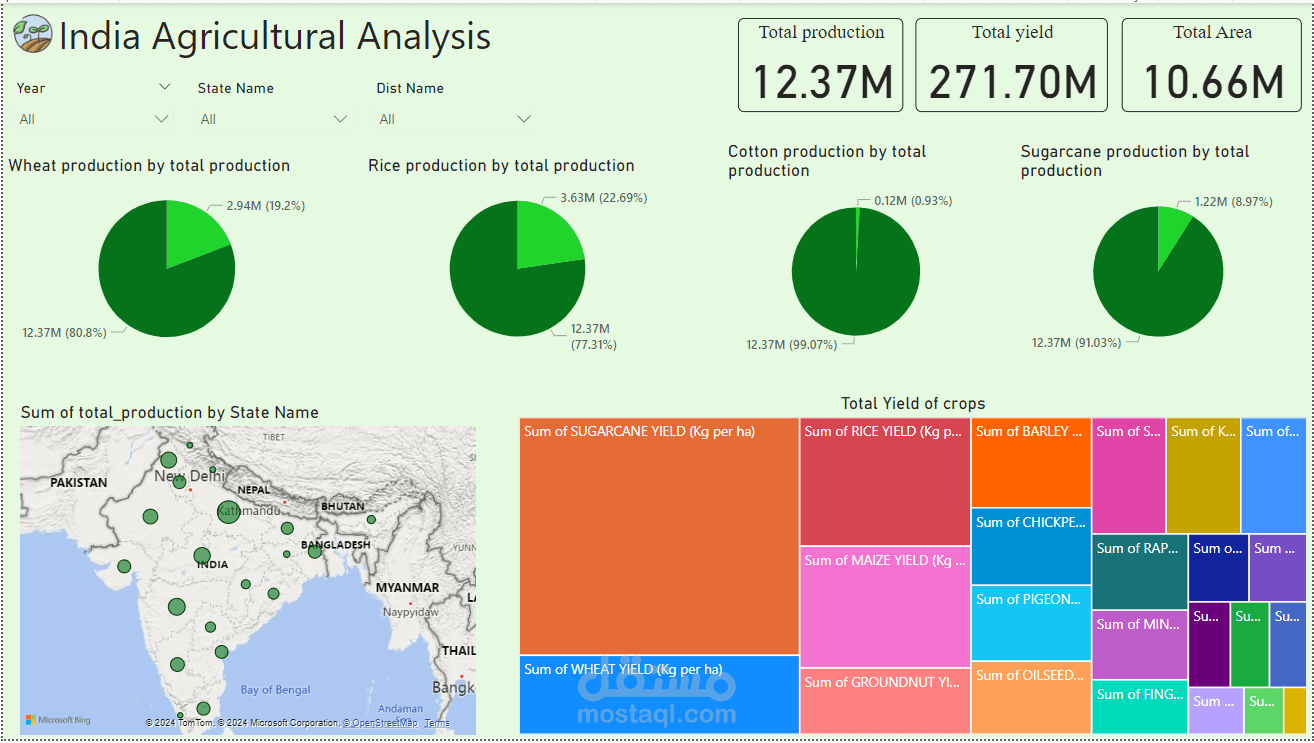
-The analysis shows that the highest production comes from Uttar Pradesh, while Kerala has the lowest production rate.
-Sugarcane is the most widely yielded crop.
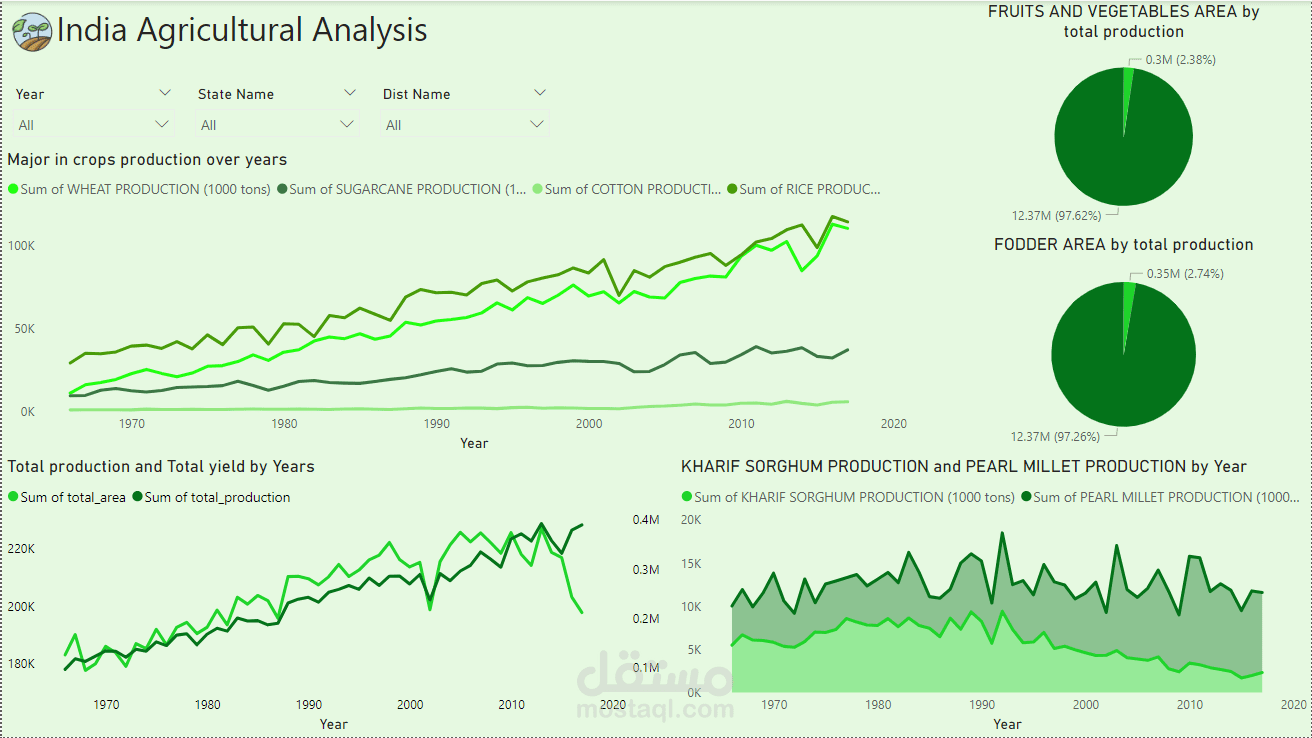
-It’s noted that the number of agricultural areas has decreased over the years. This may be due to the increase in population and the increase in the number of residential buildings.

