Sales Performance Report
تفاصيل العمل
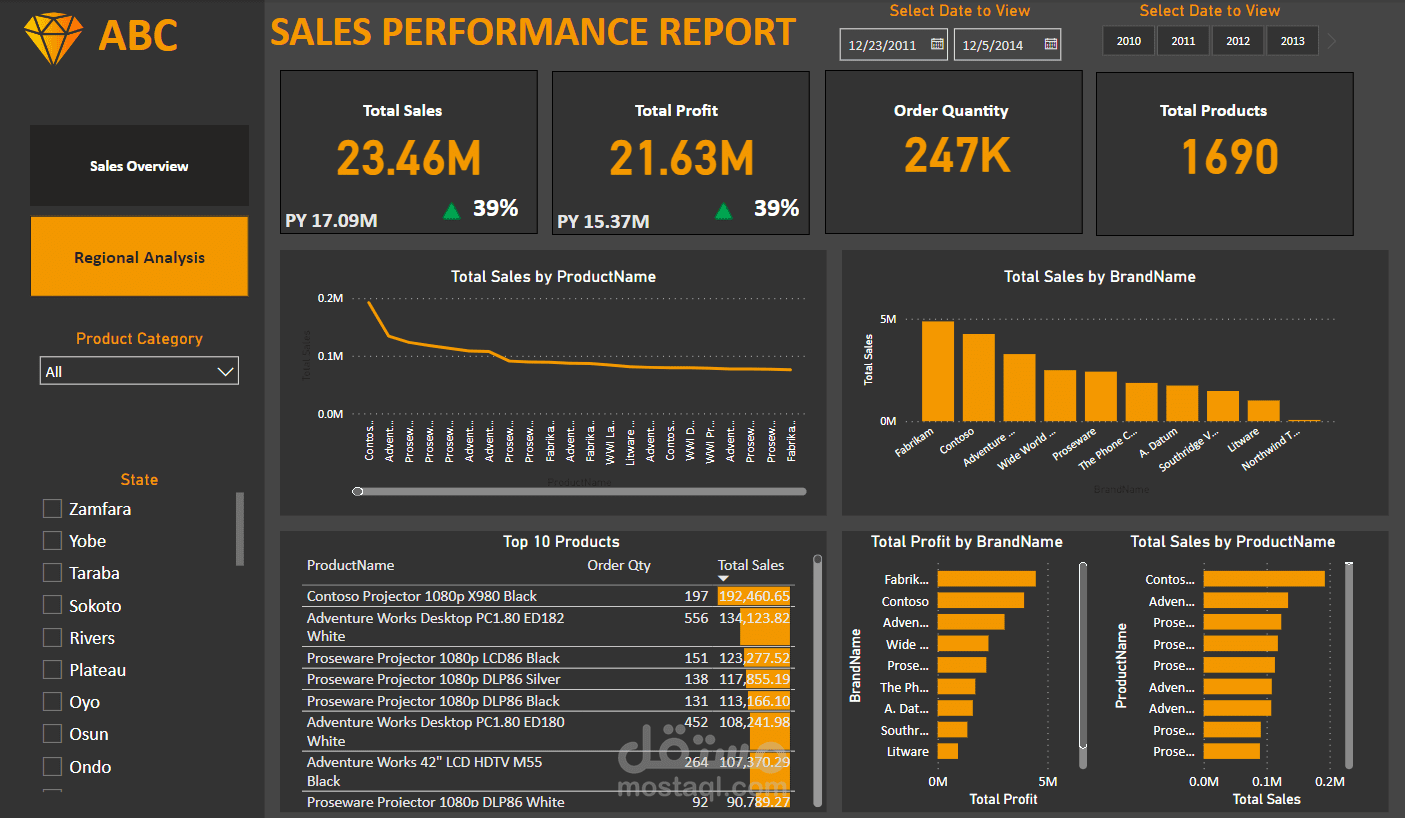
Sales Performance Report I recently completed the Sales Performance Report project, where I analyzed key metrics to gain valuable insights into our sales performance. Here are some of the highlights:
• Total Sales: $23.75 million • Total Profit: $21.89 million • Order Quantity: 250K units • Total Products Analyzed: 1,690
Visual Insights:
Line Chart: Showcasing Total Sales by Product Name, which helps identify top-performing products.
Clustered Column Charts: • Total Sales by Brand Name: Analyzing which brands are driving the most revenue. •Total Sales by Product Name: A closer look at the sales distribution across all products. • Total Profit by Product Name: Highlighting the most profitable products.
Top 10 Products Table: A deep dive into our best-sellers.
Doughnut Charts:
• Total Sales by Channel Name: Understanding which sales channels are the most effective. • Total Profit by Channel Name: Analyzing which channels contribute the most to profitability.
-- This project was an incredible learning experience, and I’m thrilled to see how data-driven insights can drive better decision-making and strategy development.