Egypt/Giza
تفاصيل العمل
Project Description: Sales Data Analysis and Dashboard Creation for Town Team Clothes Company
Objective:
To analyze and visualize sales data for the years 2015 and 2016 to uncover actionable insights, helping Town Team Clothes Company make data-driven decisions.
Project Details:
Data Cleaning:
Processed raw sales data to create new attributes: Unit Revenue, Total Cost, Total Price, and Total Revenue.
Ensured data consistency and accuracy across all attributes, preparing it for analysis.
Analysis:
Created pivot tables to extract key insights, including:
Monthly changes in Unit Price over the year.
Total Revenue trends for each month.
Number of items sold for each Product Category and Sub Category.
Total sales across different countries and their respective branches.
Quarterly Total Profit for both years.
Visualization and Dashboard Design:
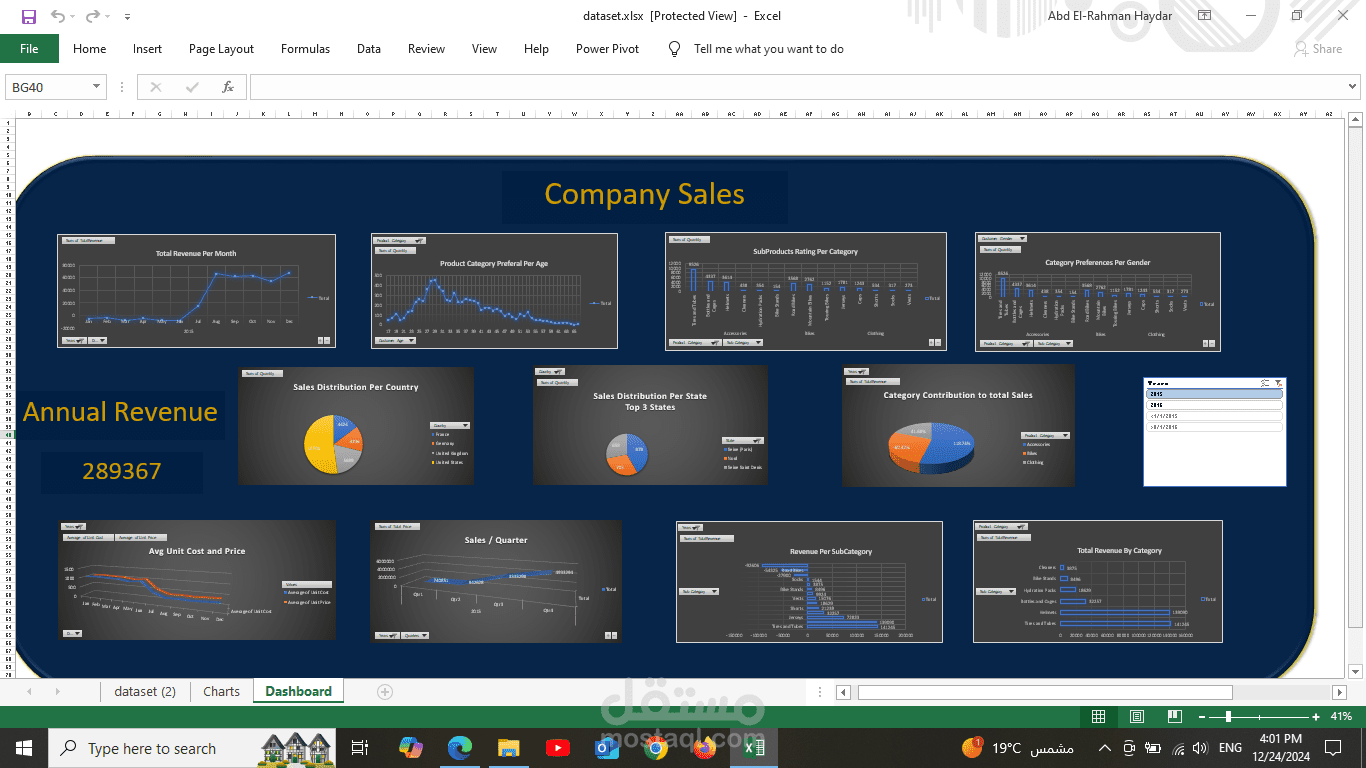
Designed an interactive Excel Dashboard showcasing:
Trends in Unit Price changes over the months.
Monthly Total Revenue breakdown.
Insights on product popularity by analyzing items sold by Product Category and Sub Category.
Sales performance for each country and its branches.
Quarterly profitability trends, enabling decision-makers to evaluate seasonal performance.
Outcome:
The project provided a comprehensive overview of sales performance and profitability trends, enabling the company to:
Identify high-performing product categories and regions.
Optimize pricing strategies based on monthly trends.
Enhance operational efficiency by focusing on profitable quarters and regions.
This project demonstrated strong proficiency in Excel for data cleaning, analysis, and visualization while delivering actionable insights tailored to the company's needs.
