dashboard لشركة
تفاصيل العمل
Report on Business Performance Dashboards
Overview This report provides an analysis of the three business performance dashboards, highlighting key insights, trends, and variance between budgeted and actual figures. The dashboards focus on revenue, variance analysis, and performance breakdown by product, year, and quarter.
-Dashboard 1: Waterfall Chart Analysis
The waterfall chart displays the count of dates by product.
Products analyzed: Aspen, Carlota, and Quad, with a cumulative total.
The budgeted amount is $45,909,436, while the actual figure is $45,716,212, showing a negative variance of ($193,224).
The chart visually represents increases and decreases, helping to understand contributions of each product to the total count.
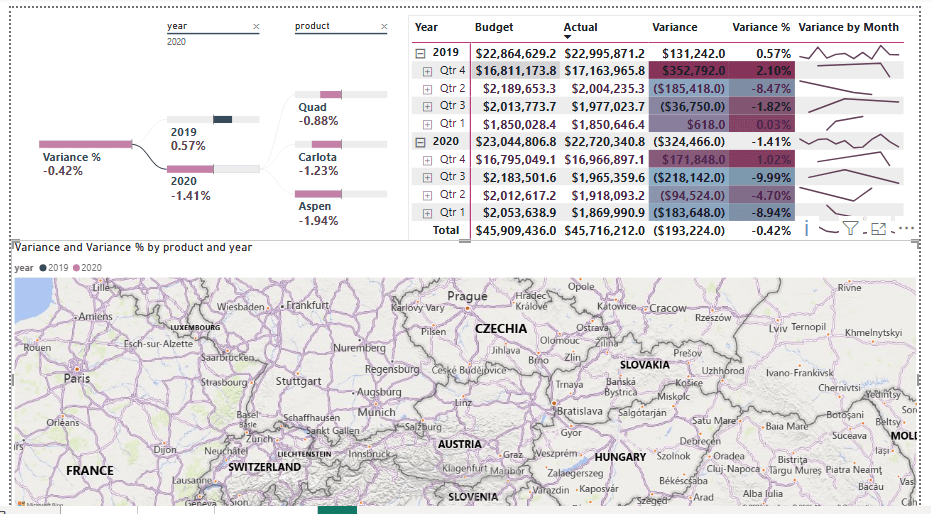
-Dashboard 2: Variance Analysis by Year and Product
This dashboard provides a breakdown of variance percentages across 2019 and 2020.
The total variance for 2020 is -0.42%, indicating a slight underperformance.
Product-specific variance:
Aspen: -1.94%
Carlota: -1.23%
Quad: -0.88%
Quarterly analysis reveals significant fluctuations, with Q3 and Q4 showing considerable negative variances.
The dashboard also incorporates a geographical map, suggesting location-based analysis of business operations.
-Dashboard 3: Budget vs. Actual and Variance Trends
The budget for the quarter analyzed is $9M, while actual revenue is $8.8M, leading to a variance of -1.94%.
Monthly variance percentage trends show a sharp decline of -16.23%, far exceeding the goal.
The budget, actual, and variance percentages are displayed for each quarter, showing a substantial increase in variance during Q4.
The visual representation highlights a concerning drop-off in performance compared to projections.
-Key Findings and Recommendations
1-Negative Variance Impact: Across all dashboards, actual revenue underperformed against the budget, requiring strategic adjustments to close gaps.
2-Product Performance: Aspen showed the highest negative variance, necessitating a closer look at its market dynamics and potential corrective measures.
3-Quarterly Trends: Q3 and Q4 exhibited sharp declines, suggesting seasonality or external market influences impacting revenue.
4-Geographic Considerations: The presence of a map in the second dashboard suggests regional impacts on performance that should be further explored.
5-Action Plan:
-Conduct a deep dive into Aspen’s revenue drivers.
-Address Q4 volatility with improved forecasting and cost controls.
-Explore geographic-based strategies to improve performance in specific regions.
-Strengthen month-over-month monitoring to mitigate variance shocks.
Conclusion:-
The dashboards indicate an overall downward variance in revenue performance, particularly in 2020, with significant gaps in Q3 and Q4. Addressing product-specific and seasonal challenges, as well as incorporating regional insights, will be crucial in improving future business performance