Global Climate Data Dashboard
تفاصيل العمل
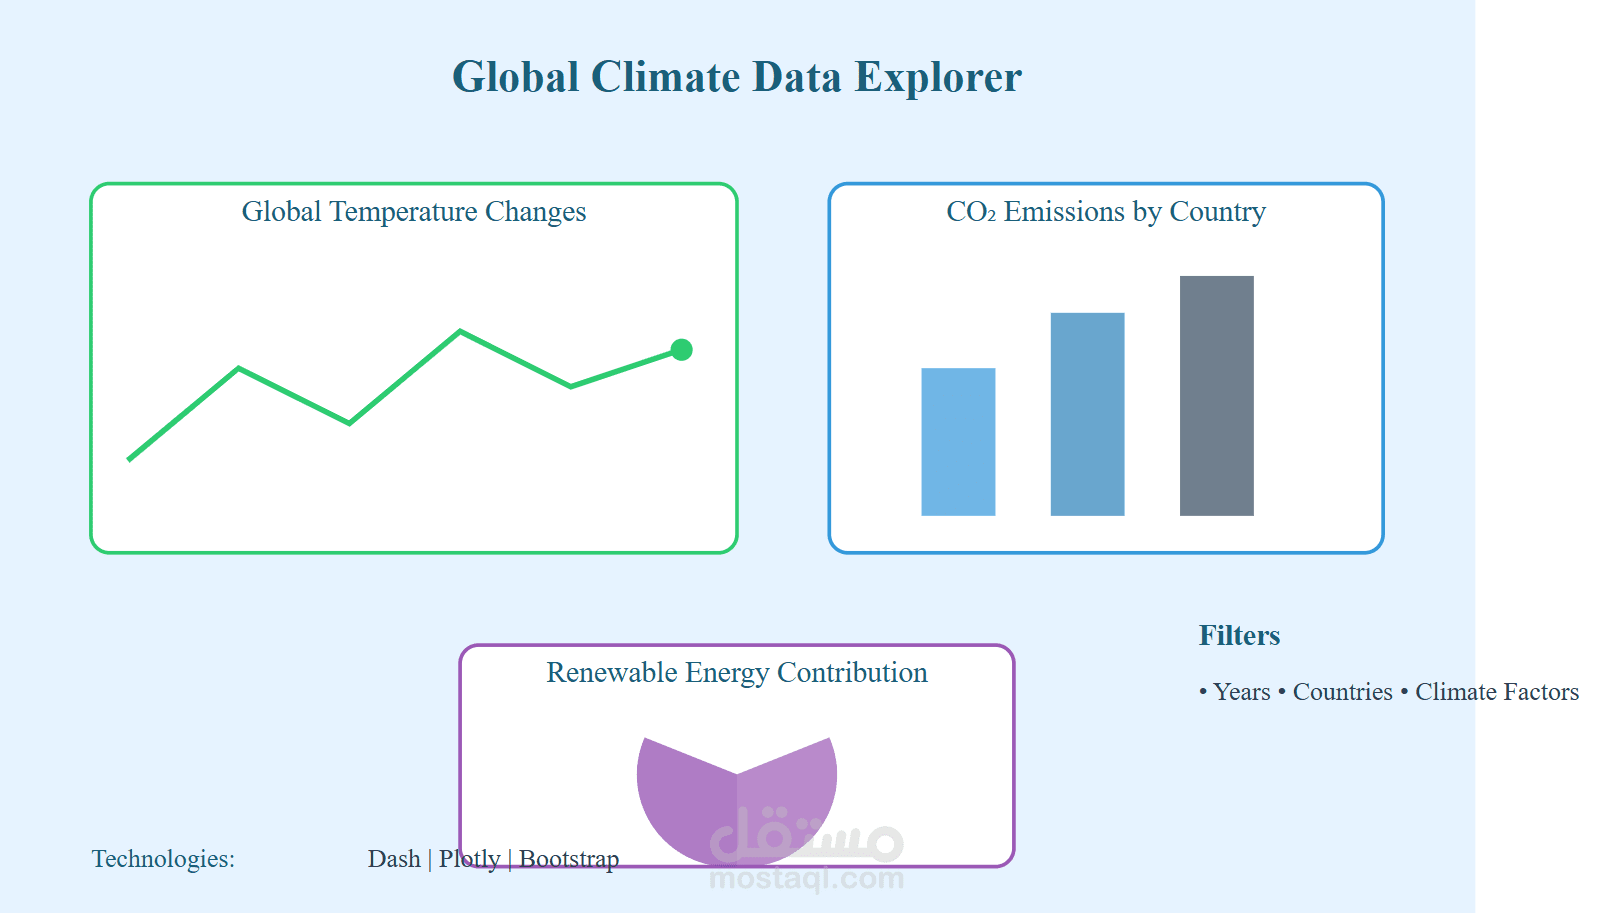
This project is an interactive Global Climate Data Dashboard built using Dash, Plotly, and Bootstrap to explore climate trends across different regions. The dashboard provides insights into temperature changes, CO₂ emissions, and renewable energy consumption over time.
Key Features:
Dynamic Filtering: Select specific years, countries, and climate factors for detailed analysis.
Interactive Charts:
Line Chart to track temperature changes over decades.
Bar Chart showing CO₂ emissions by country.
Pie Chart visualizing renewable energy contributions.
Real-time Updates: Instant dashboard refresh based on user input.