bank data analysis
تفاصيل العمل
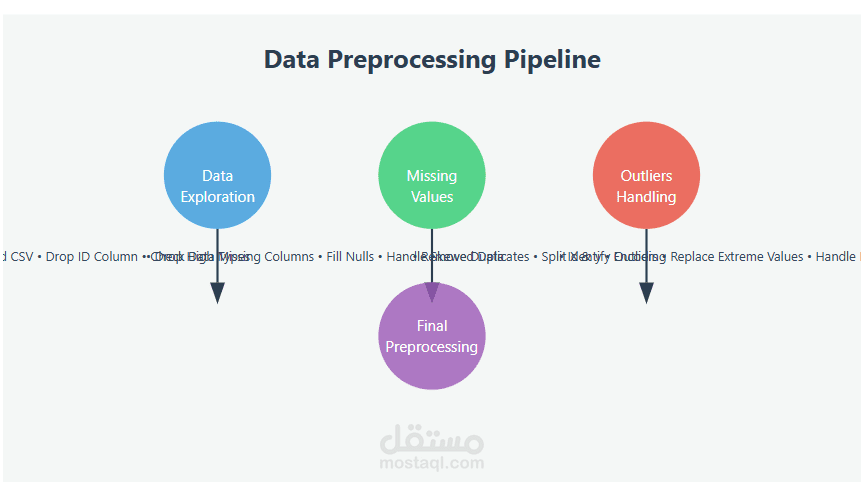
In this project, I cleaned and prepared data for analysis using a structured pipeline:
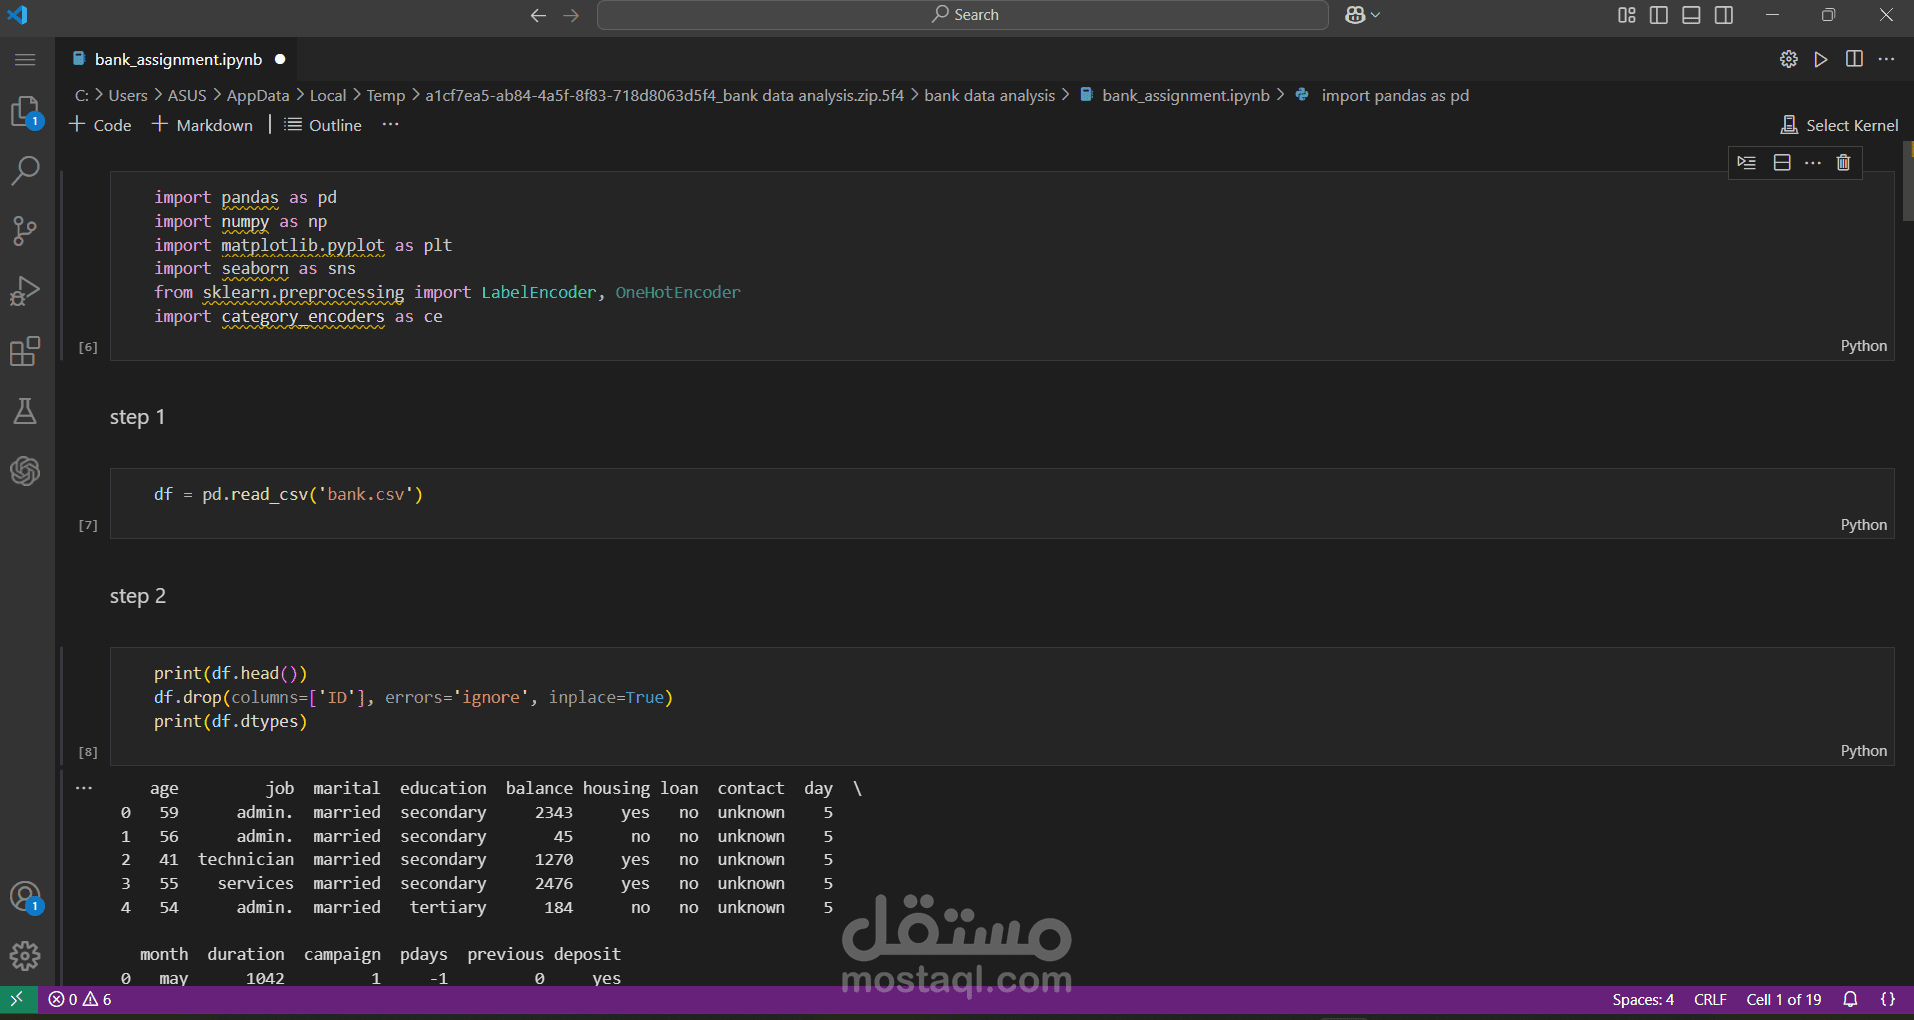
Data Exploration: Loaded a CSV file, displayed samples, dropped the ID column, checked data types, and converted categorical features.
Missing Values: Dropped columns with high missing ratios, filled categorical nulls with mode, and handled skewed numerical data using the median.
Outliers: Identified using Box Plots; replaced extreme values with upper/lower bounds and rare categorical occurrences with mode.
Duplicates & Encoding: Removed duplicates, split data into X & y, and applied Label Encoding, Binary Encoding, or One-Hot Encoding based on category counts.