Social Media Analytics Dashboard
تفاصيل العمل
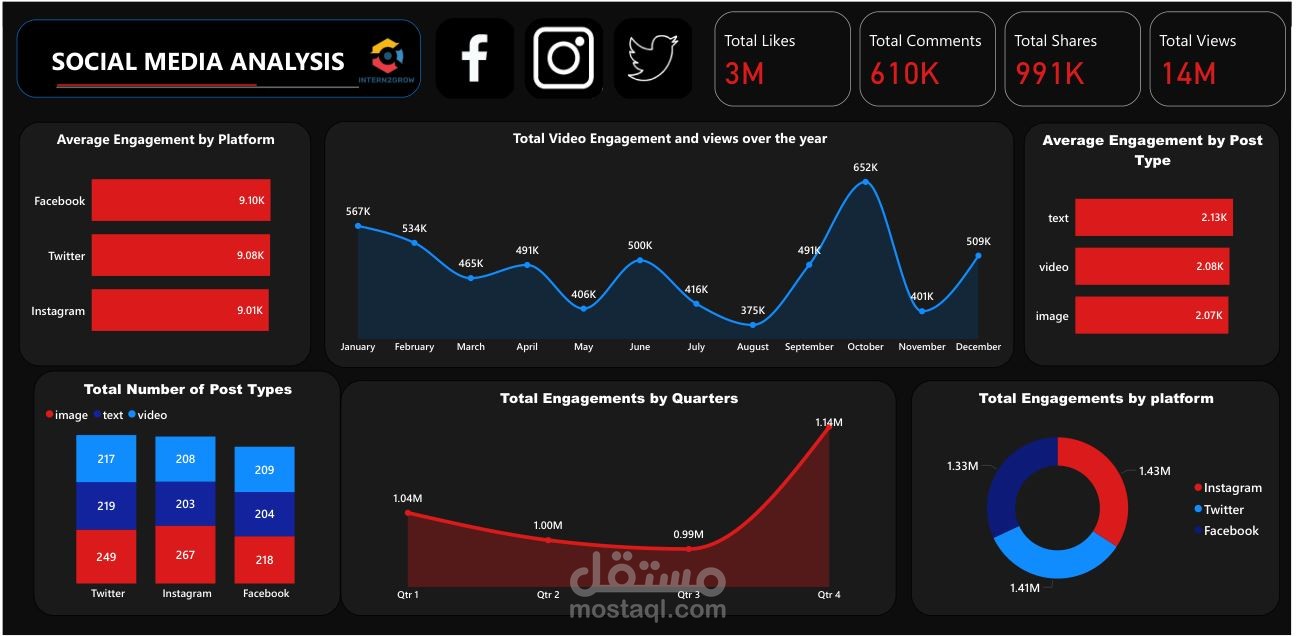
my second task as a Data Analyst at Intern2Grow where I focused on social media analysis. For this task, I utilized Excel to perform data cleaning, which included identifying null values, removing irrelevant data, detecting outliers, and validating data types. I further employed pivot tables for in-depth analysis and used functions such as SUM and SUMIFS to aggregate the necessary data.
The objective was to address the following business questions, which were effectively answered through the accompanying dashboard:
1. What was the total number of likes, shares, comments, and views (for videos) over the year?
2. Which platform had the highest engagement? (engagement = likes + shares + comments)
3. What was the average number of likes, shares, comments, and views per post on each platform?
4. What was the total number of each type of post (video, image, text) on each platform?
5. Which type of post had the highest average engagement?
6. What was the total engagement in each quarter of the year?