داش بورد علي tableau
تفاصيل العمل
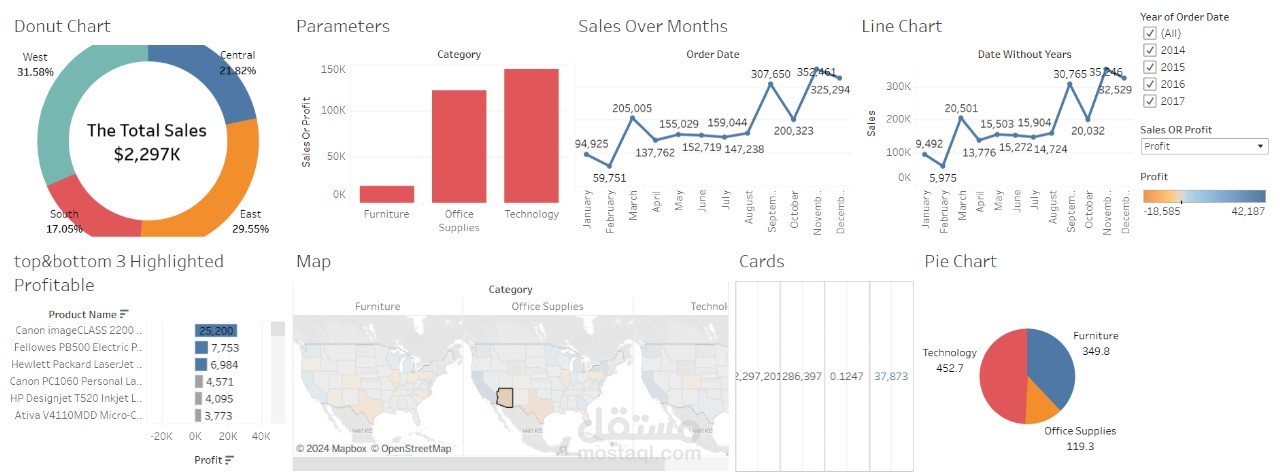
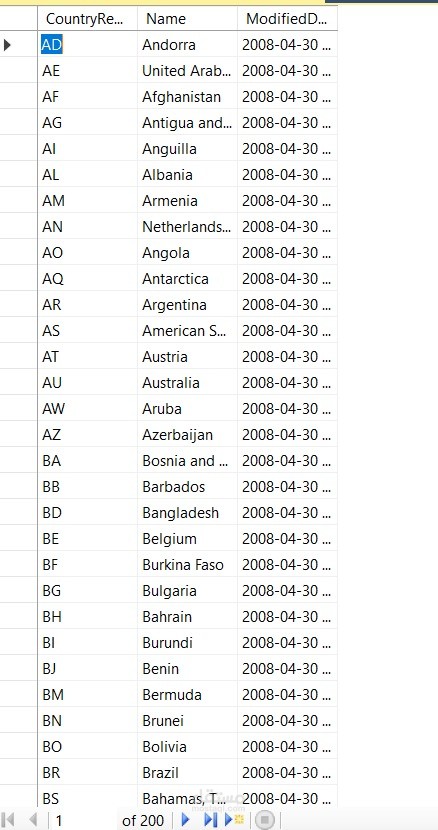
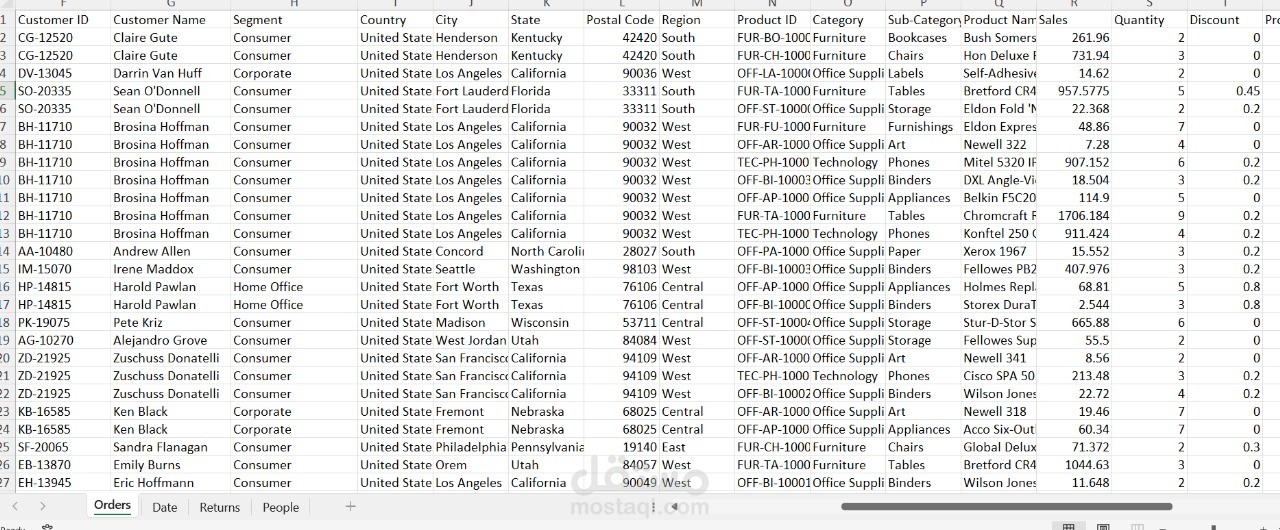
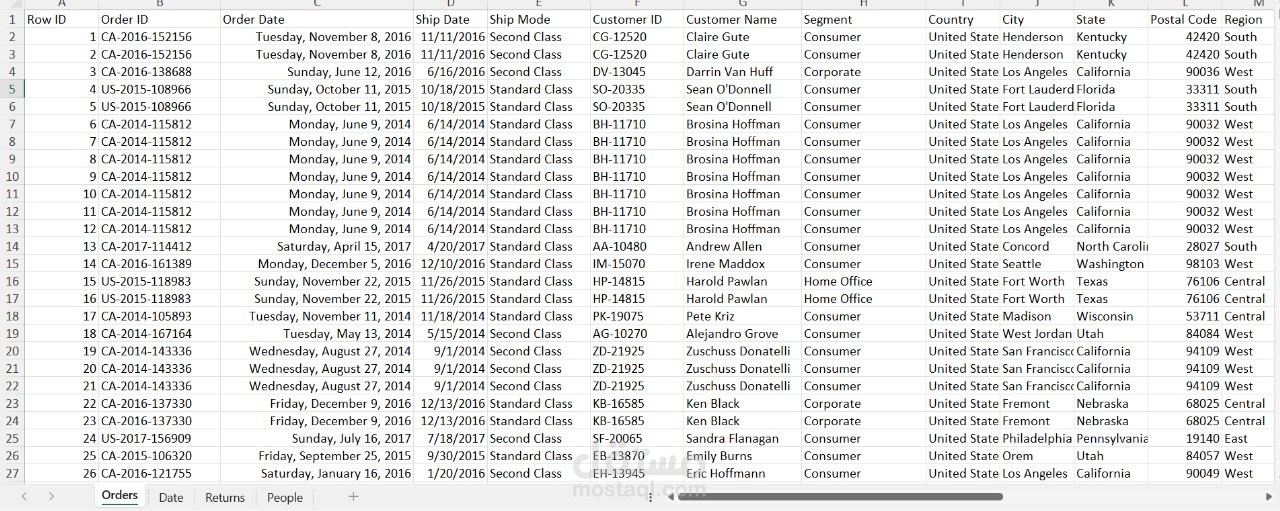
العمل عبارة عن لوحة بيانات تفاعلية مصممة باستخدام Tableau لتحليل وعرض بيانات بشكل مرئي. اللوحة تتضمن مخططات ورسوم بيانية تساعد على تتبع الأنماط، مقارنة الفئات، أو عرض الأداء بناءً على معايير محددة. الهدف هو تبسيط المعلومات لتسهيل فهمها واتخاذ القرارات By using Sample superstore File Find
1. Create Cards for Total Sales, Total Profit, Profit Ratio, Quantity
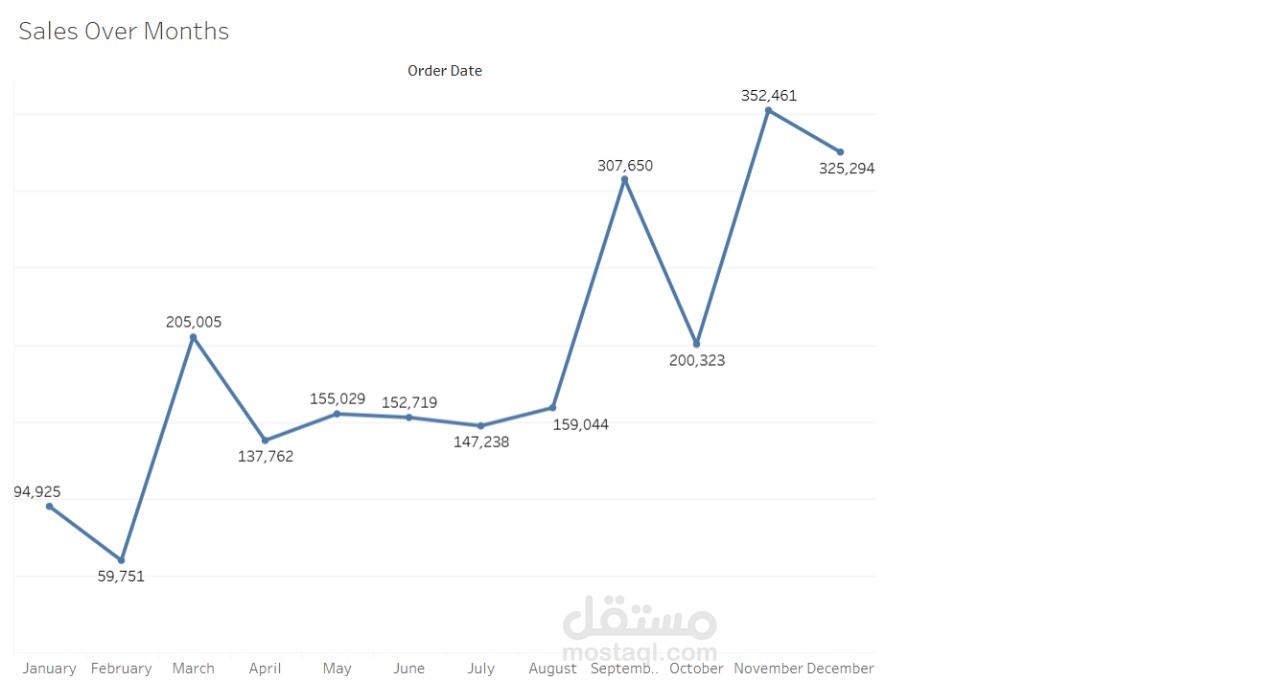
2. Sales over months
3. Top & Bottom 3 Highlighted Profitable Product in one visual
4. Create map shows each state with category insight
5. Create parameter shows total sales, total profit for each category
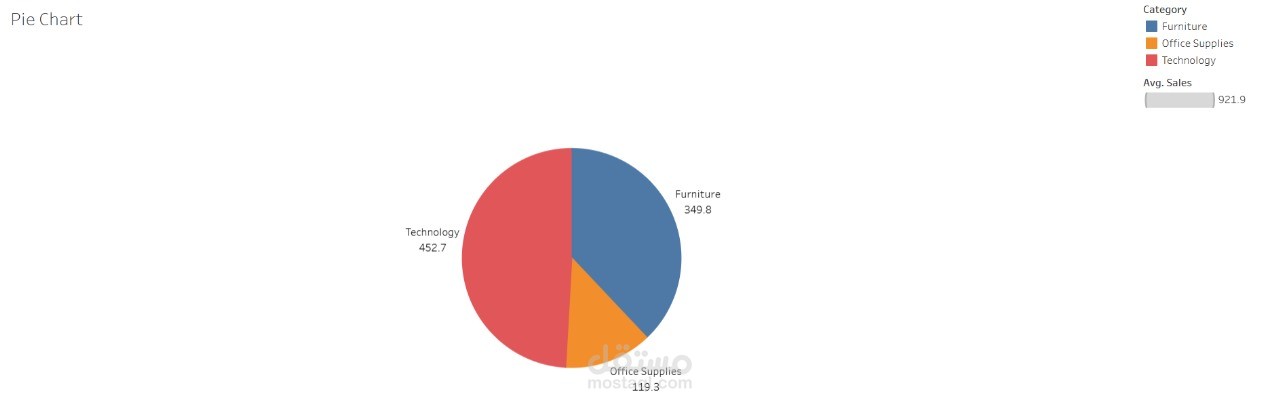
2- Using Sample super store Data, Create Pie Chart shows Avg sales of
Each Category
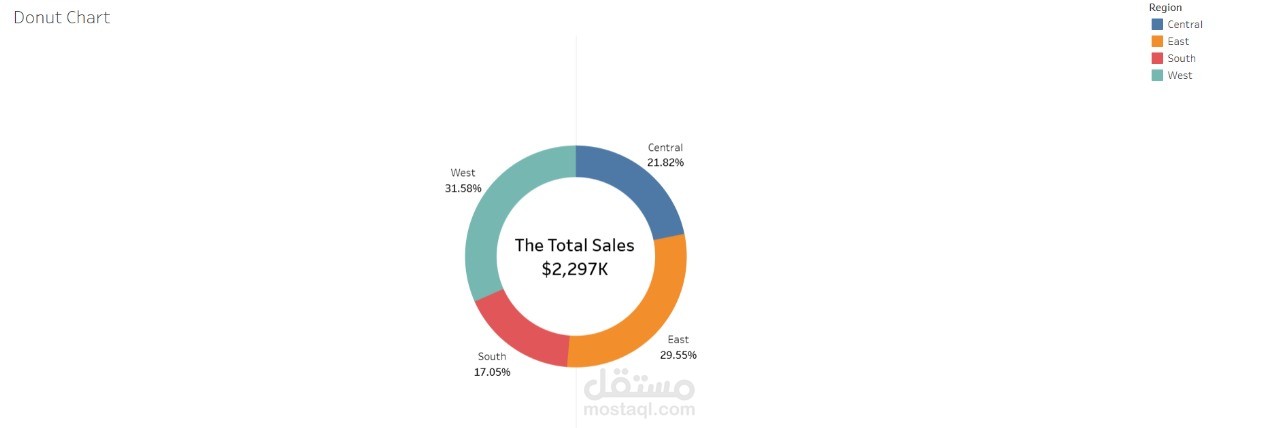
3- Using Sample super store Data, Create Donut Chart shows - -
Total sales in “K” with $ Symbol
Each Region % Of Total Regions
4- Create Line Chart shows months by Tax of Sales for each year
5- Create Simple Dashboard with All Previous Elements