KPI-Dashboard
تفاصيل العمل
Top Section: Revenue and Customer Metrics
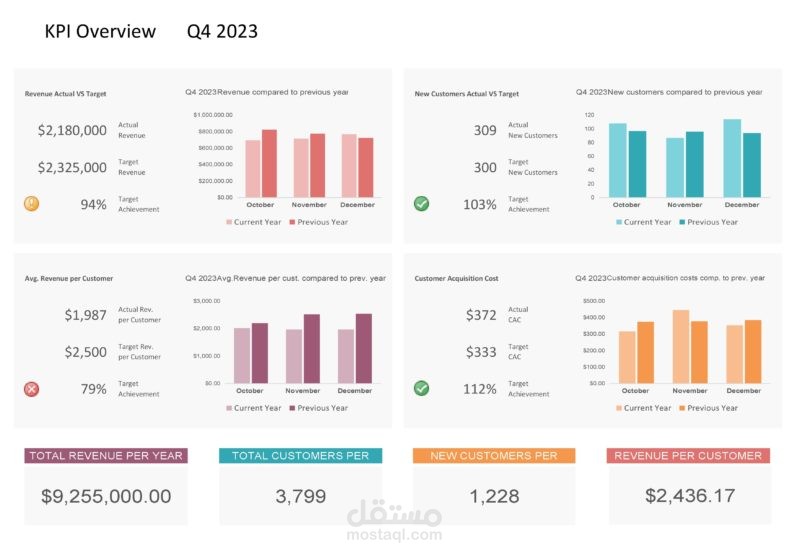
Revenue Actual vs. Target
Actual Revenue: $2,180,000
Target Revenue: $2,325,000
Target Achievement: 94% (represented with a warning icon).
A bar chart shows monthly revenue (October–December) comparing the current year against the previous year.
New Customers Actual vs. Target
Actual New Customers: 309
Target New Customers: 300
Target Achievement: 103% (indicated with a green checkmark).
A bar chart displays new customer numbers for Q4 by month, comparing the current year to the previous year.
Middle Section: Customer Metrics
Average Revenue per Customer
Actual Revenue per Customer: $1,987
Target Revenue per Customer: $2,500
Target Achievement: 79% (shown with a red warning icon).
A bar chart compares average revenue per customer (October–December) between the current and previous years.
Customer Acquisition Cost (CAC)
Actual CAC: $372
Target CAC: $333
Target Achievement: 112% (denoted with a green checkmark).
A bar chart shows CAC by month (October–December), comparing the current year with the previous year.
Bottom Section: Summary Metrics
Total Revenue per Year: $9,255,000
Total Customers per Year: 3,799
New Customers per Year: 1,228
Revenue per Customer: $2,436.17
Key Features
Bar Charts: Each KPI is visualized monthly (October, November, December), comparing the current year to the previous year.
Icons: Indicators (green checkmarks, red warnings) quickly convey whether the target has been achieved.
Color Coding: Clear visual distinctions for data points, enhancing readability and analysis.
بطاقة العمل
| اسم المستقل | محمد أ. |
| عدد الإعجابات | 1 |
| عدد المشاهدات | 8 |
| تاريخ الإضافة |
