Superstore Analysis Project Using Python and Tableau
تفاصيل العمل
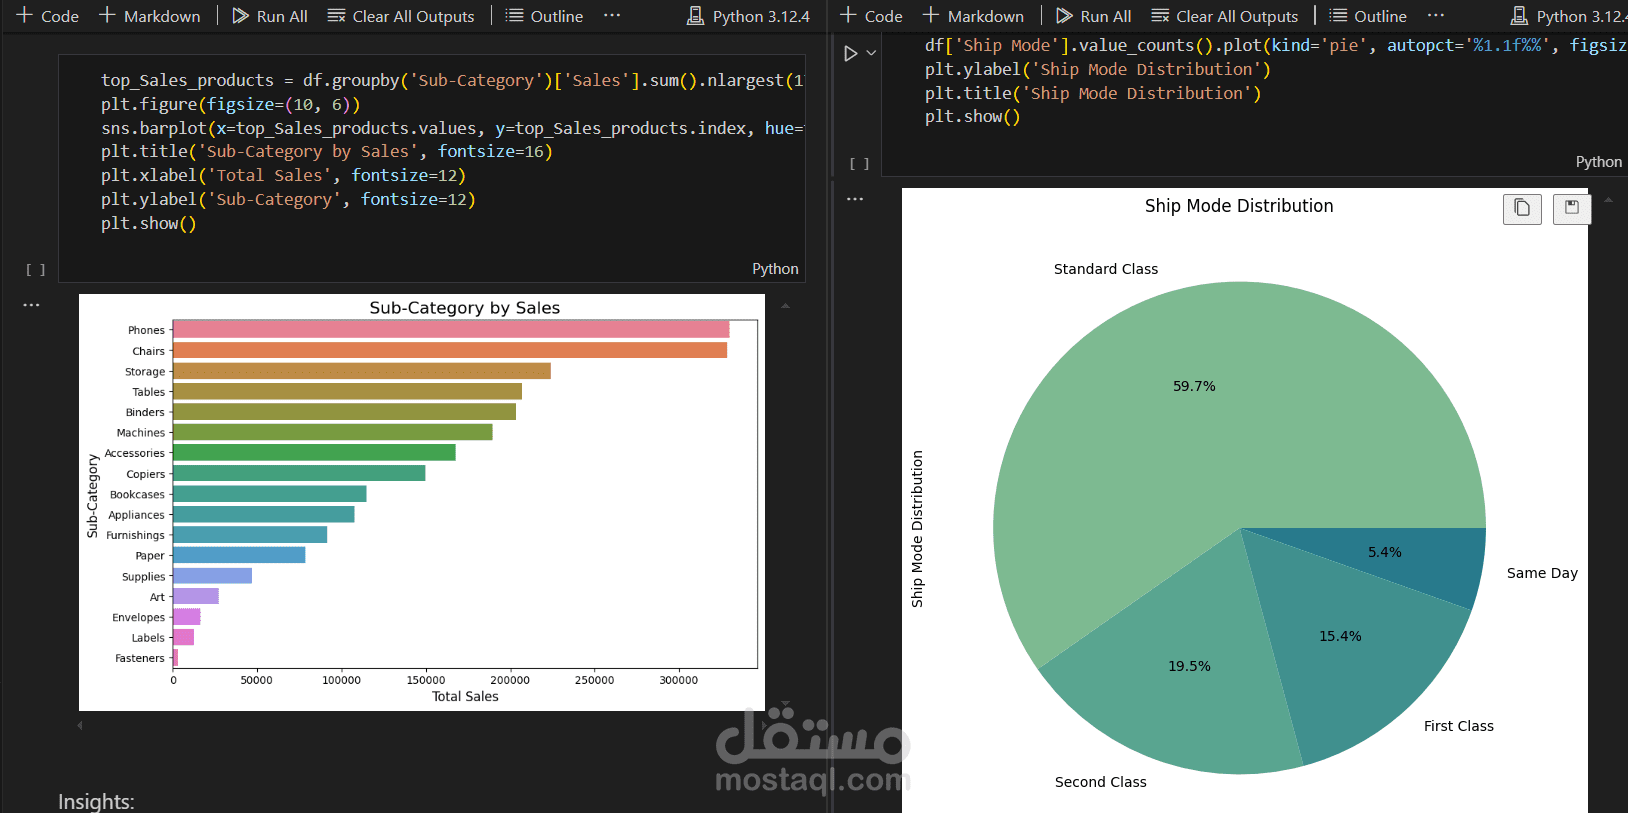
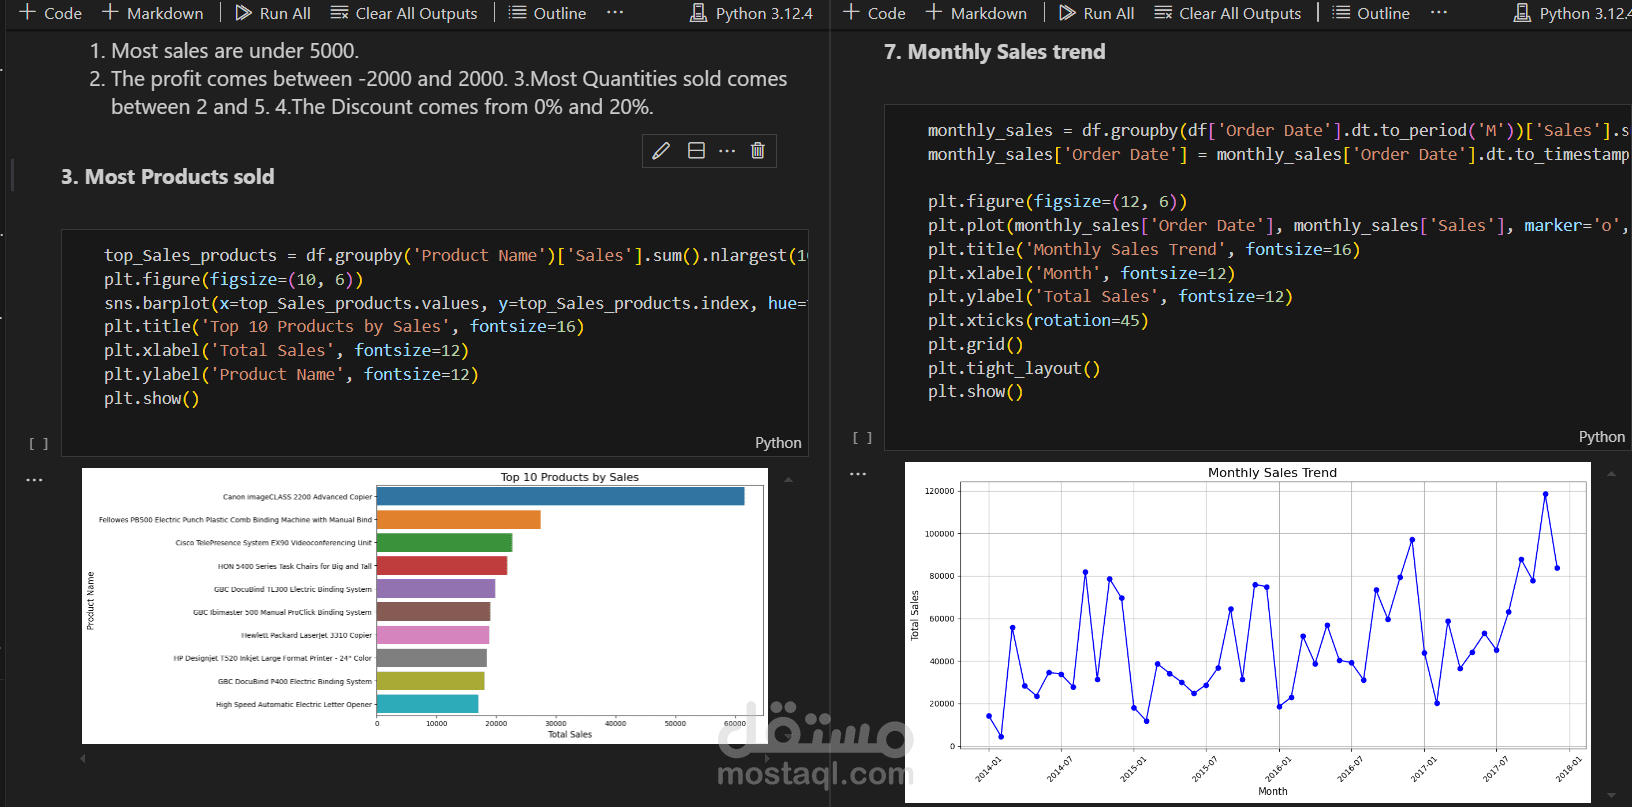
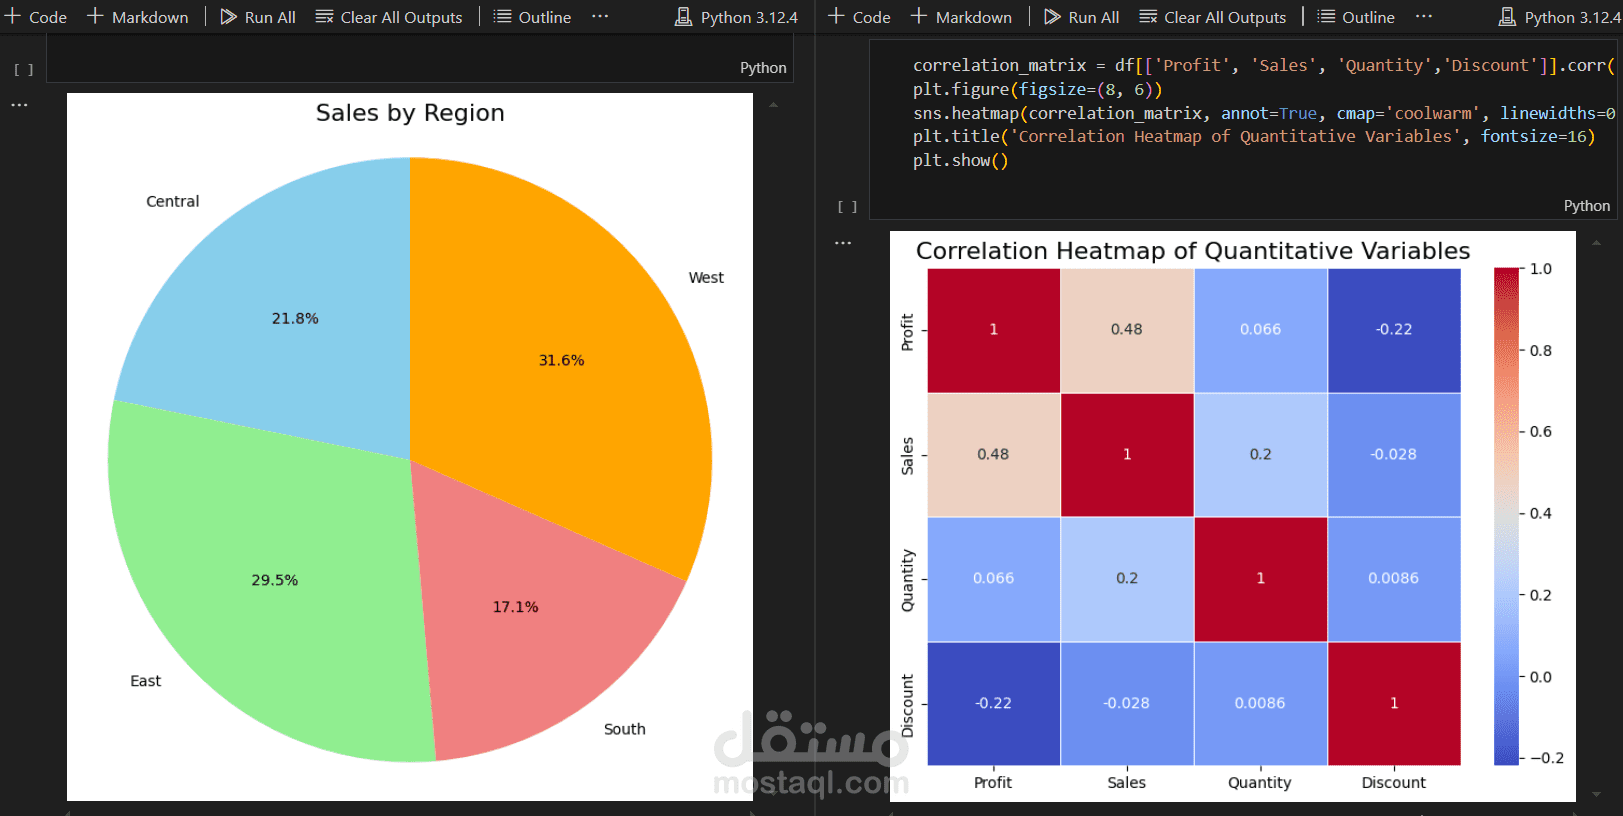
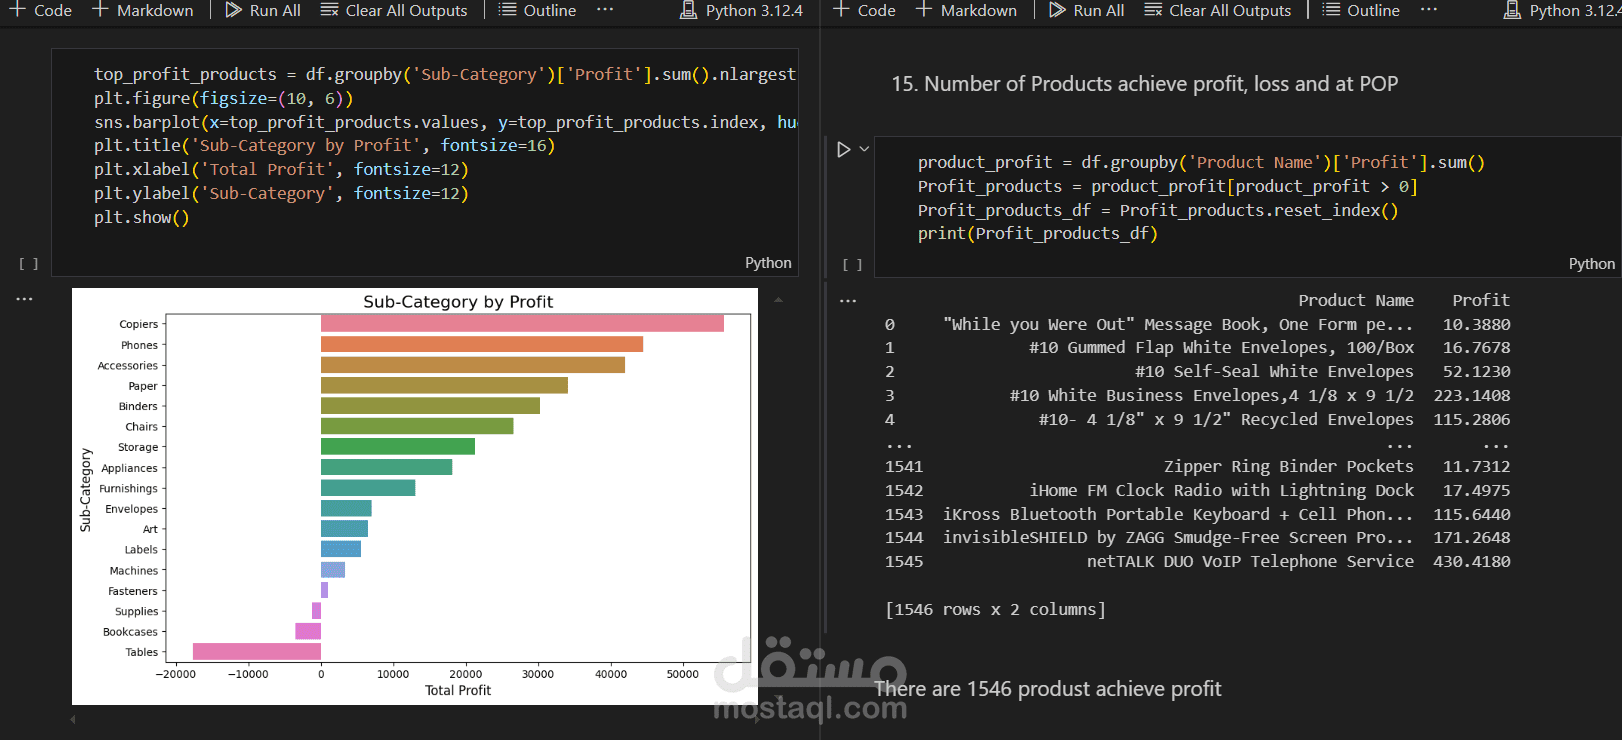
I performed a complete data analysis for a superstore dataset. The workflow began with data cleaning and preprocessing using Python to ensure the dataset was accurate and ready for analysis. I then conducted statistical and exploratory data analysis (EDA) using Python libraries like Pandas, NumPy, and Matplotlib to uncover initial patterns and trends in the data.
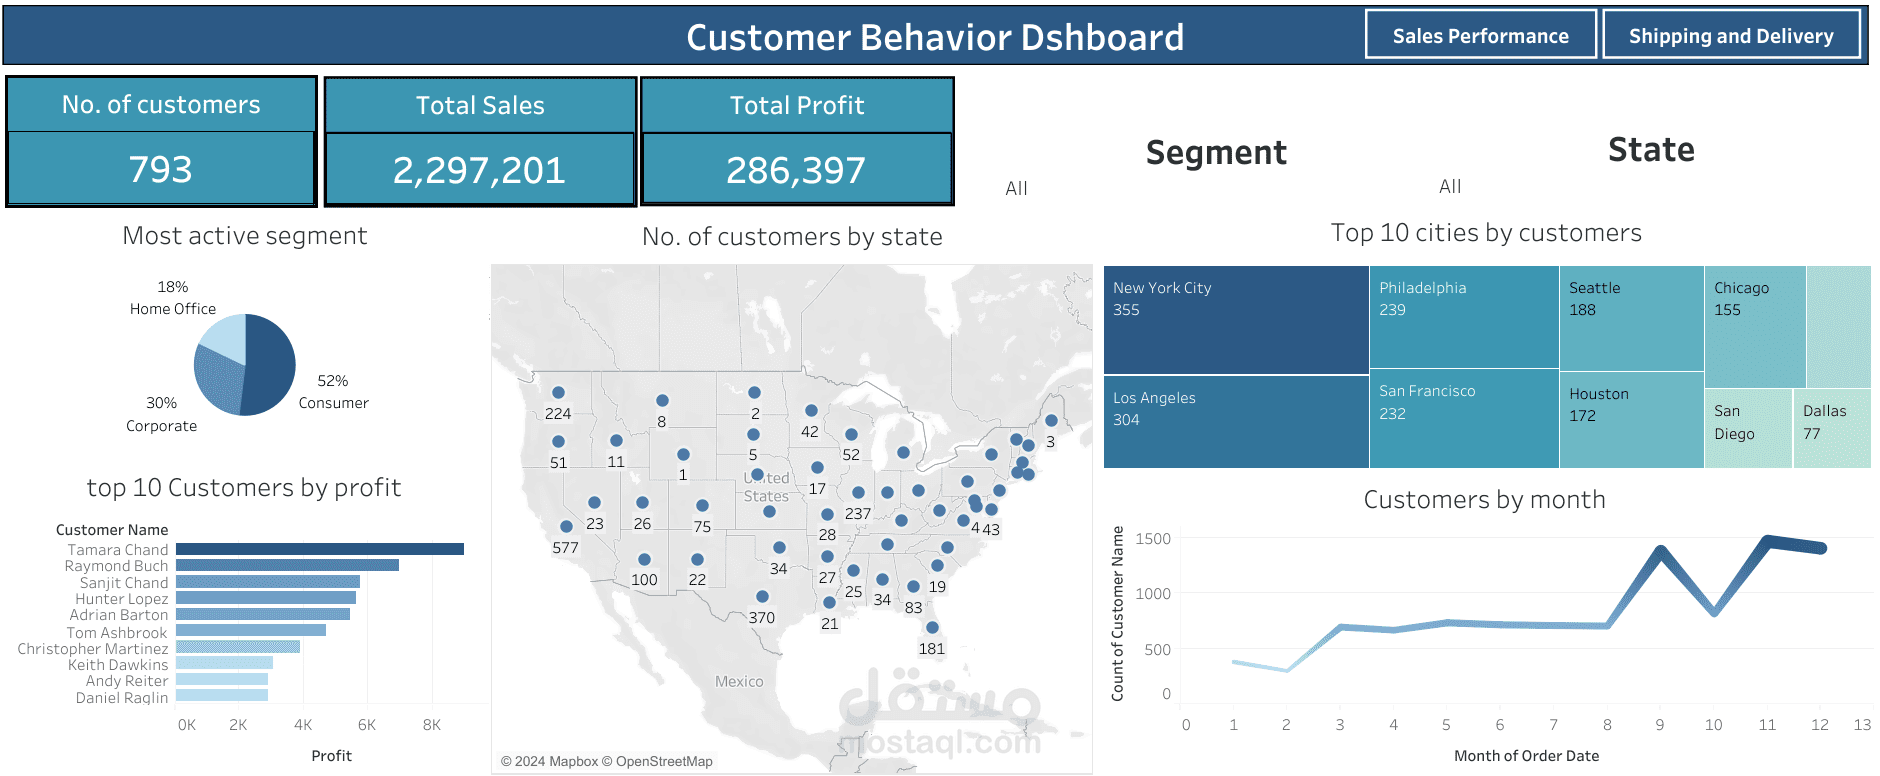
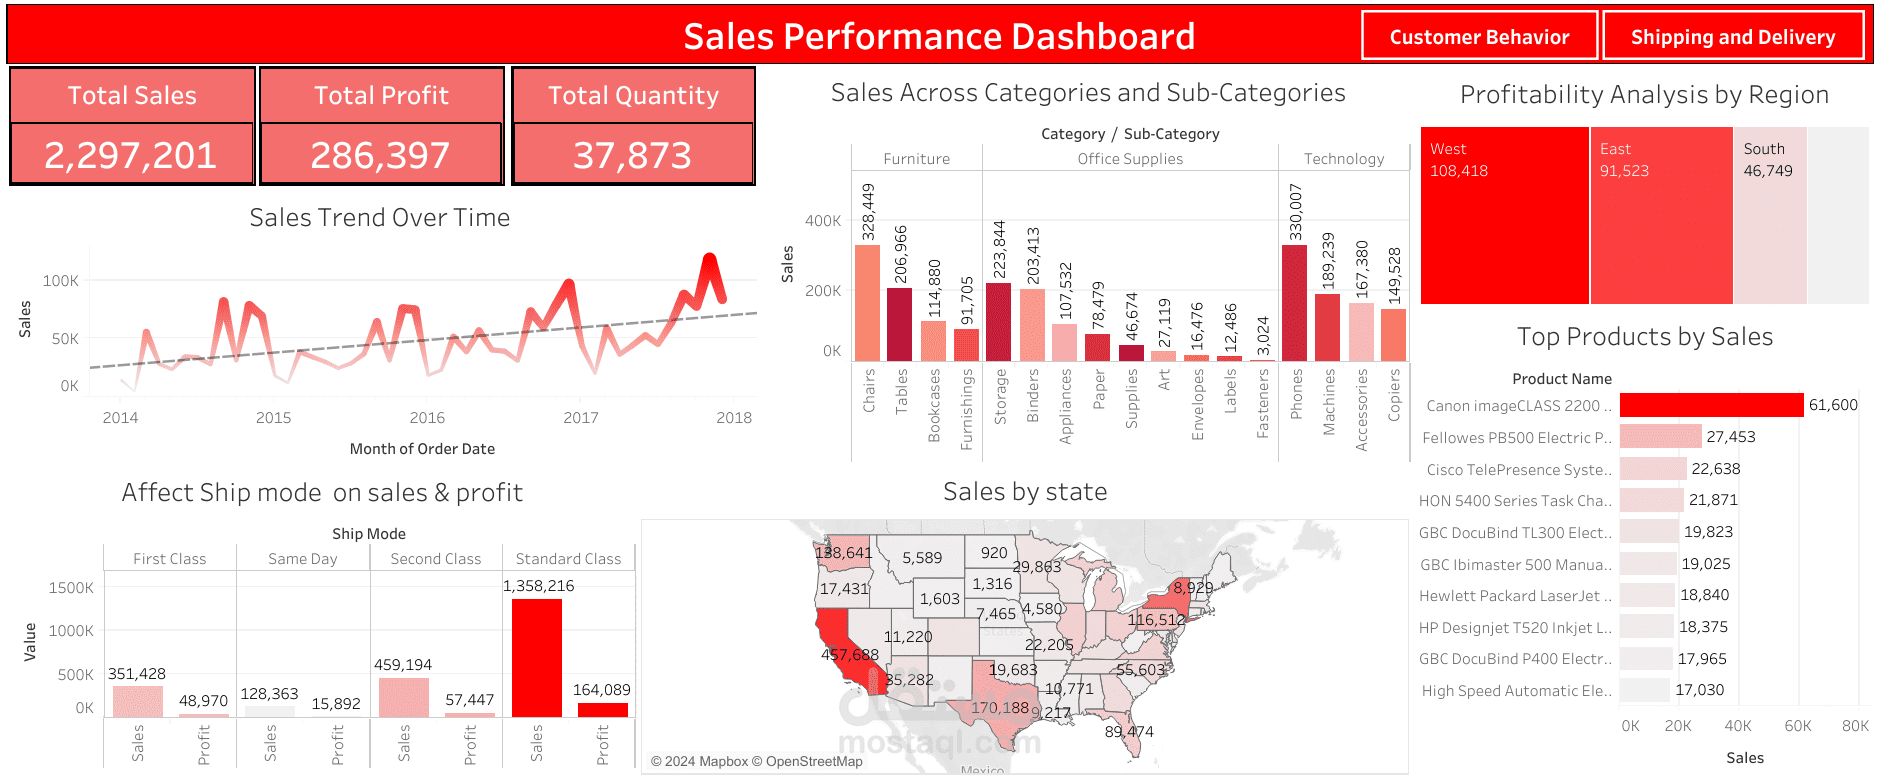
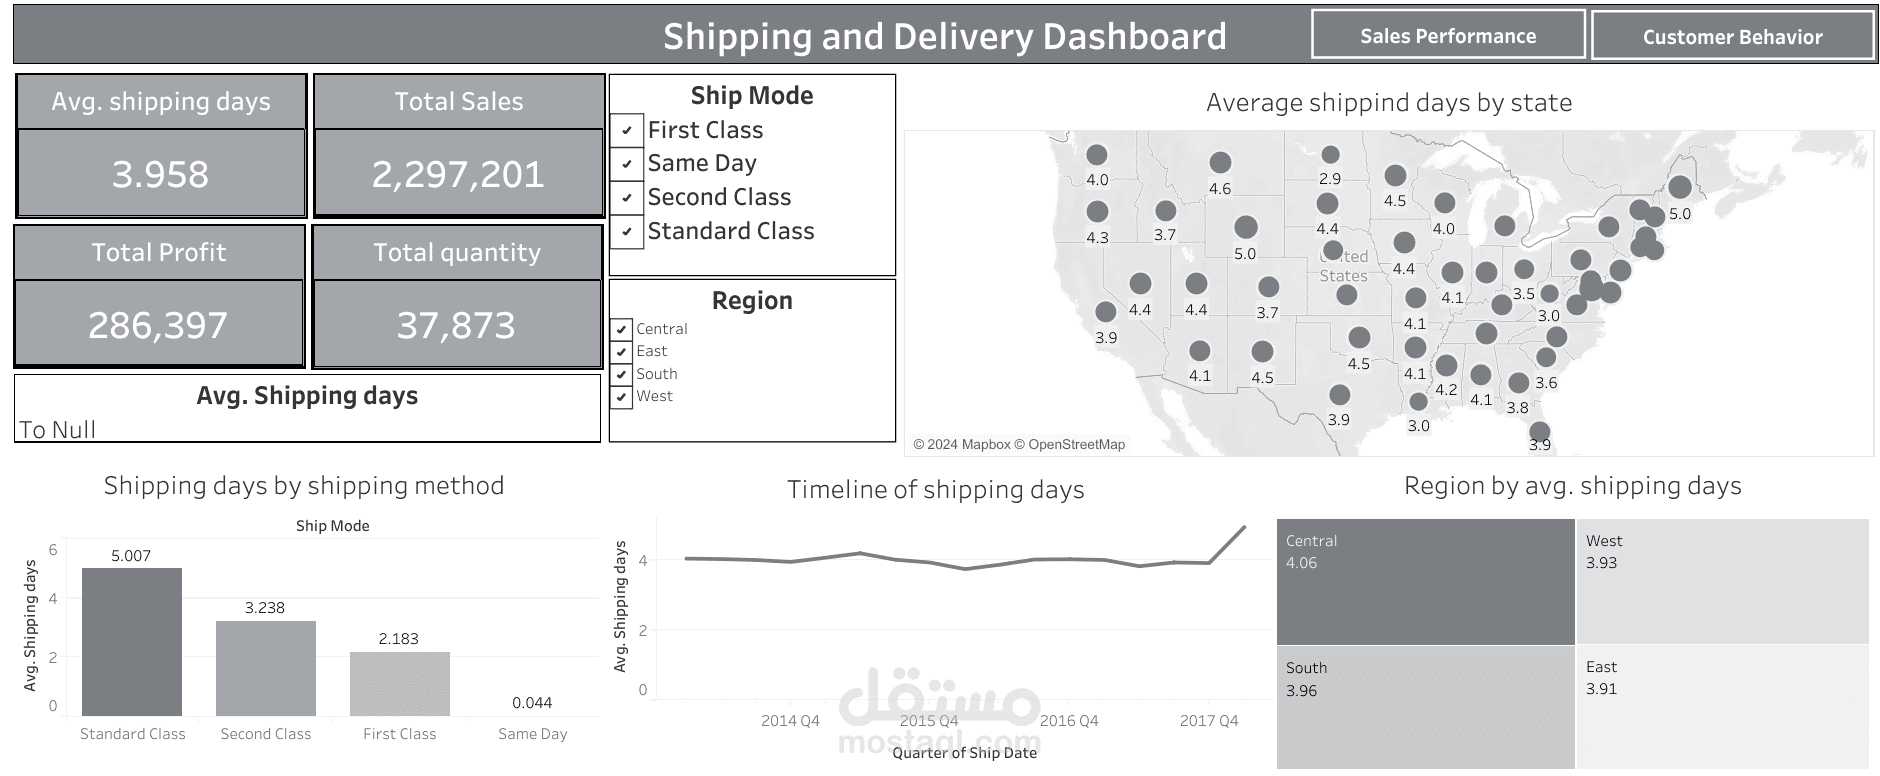
For the full analysis and visualization, I utilized Tableau to create three interactive dashboards, each tailored to answer specific business questions, such as customer behavior, sales performance, and shipping efficiency. These dashboards provide actionable insights to drive data-informed decisions and improve the overall business strategy.
