Sales & E-Commerce Analytics Dashboard (Power BI | DAX | Data Modeling)
تفاصيل العمل

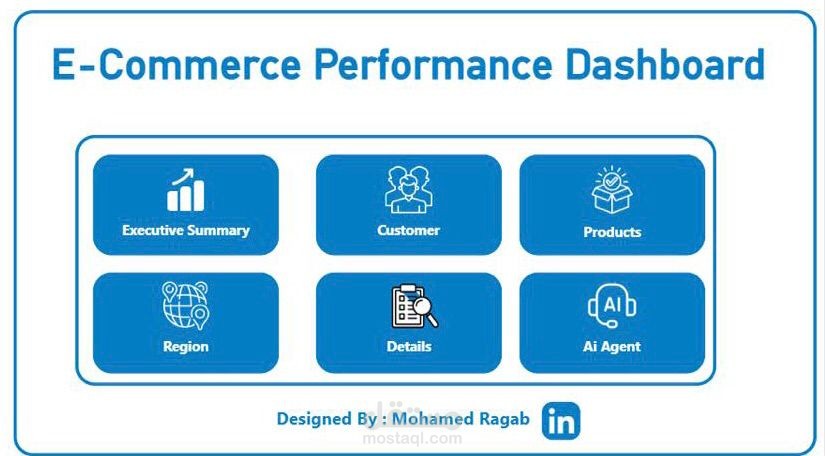
? Sales & E-Commerce Analytics Power BI Report
This project delivers a complete end-to-end analytics solution for an e-commerce business, providing insights into customer behavior, product performance, and regional sales trends. The report is fully interactive, visually modern, and optimized for business decision-making.
? Key Features
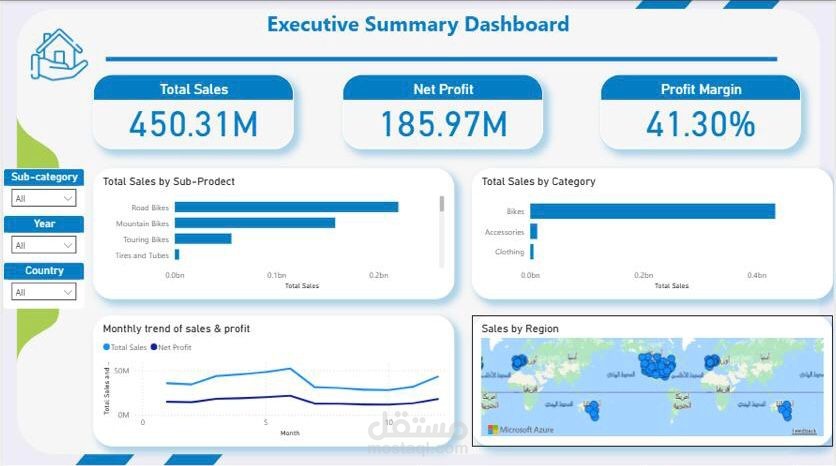
Executive Summary Dashboard
Total Sales, Profit, Orders, Customers
MoM growth, YOY trend
High-level KPIs for quick decision-making
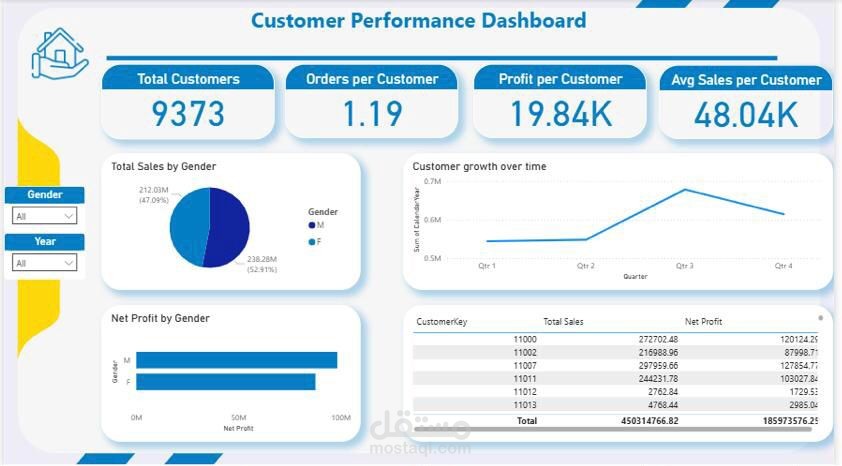
Customer Analytics Dashboard
Customer segmentation by gender & maturity
Sales per customer, frequency, retention
Customer growth trend
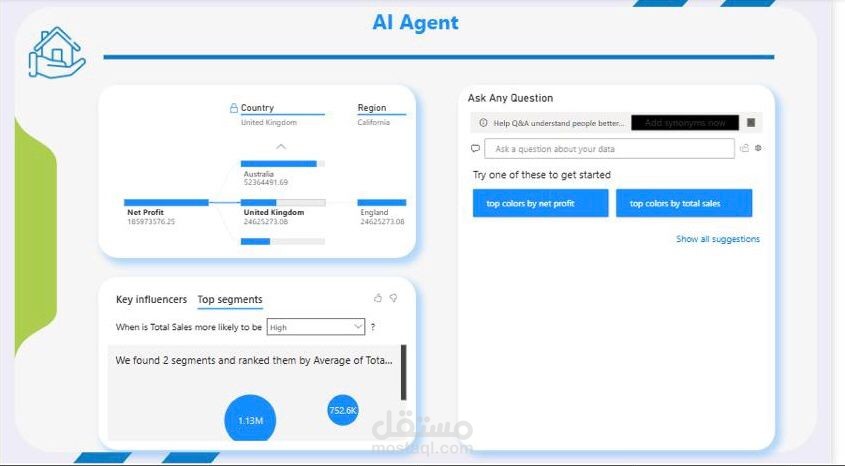
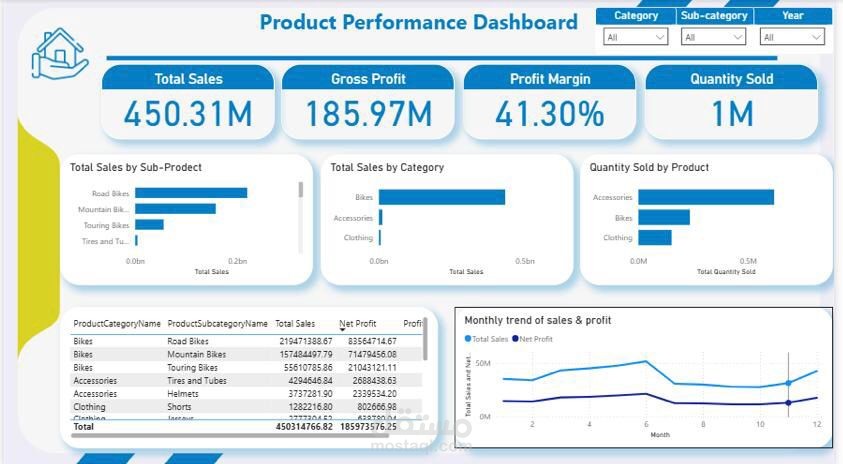
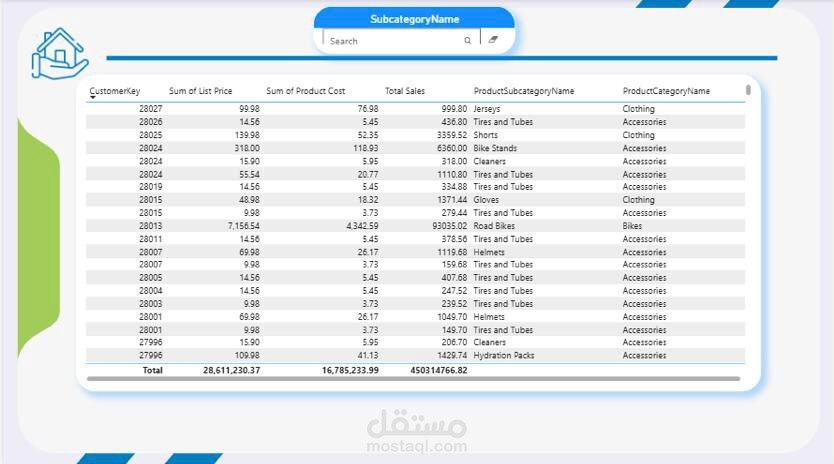
Product Performance Dashboard
Sales by category, sub-category, and color
Profitability analysis (ASP, Cost, Margin, Ranking)
Top 10 products and performance matrix
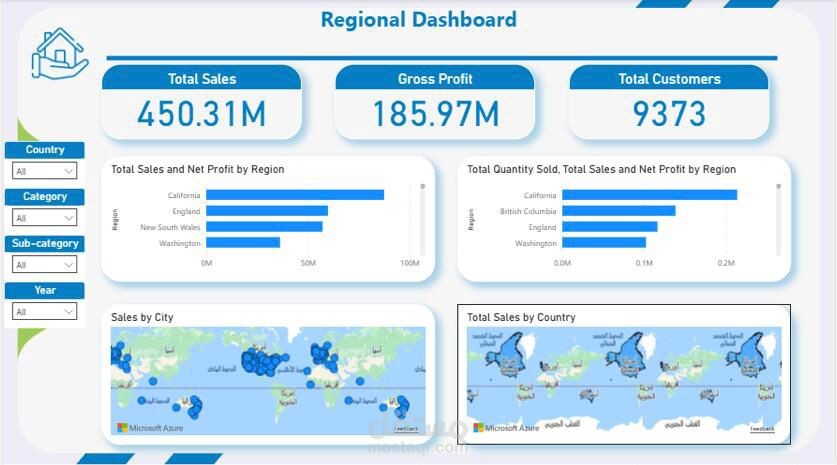
Regional Sales Dashboard
Sales by country, region, and city
Regional profitability and contribution %
Geo-visualization for geographic insights
? Data Modeling
Star schema with:
1 Fact table: Fact Sales
6 Dimension tables: Date, Customer, Product, Category, Subcategory, Region
Measures created using DAX for KPIs such as:
Total Sales
Gross Profit
Profit Margin
Sales Growth
Sales Per Customer
AOV (Average Order Value)
Quantity Sold
? Tools & Technologies
Power BI Desktop
DAX (Data Analysis Expressions)
Data Modeling (Star Schema)
ETL preparation & data cleaning
? Outcome
The final report enables business teams to:
Identify best-performing regions and products
Understand customer behavior and profitability
Track sales trends & forecast performance
Make data-driven decisions quickly