Data Science | Telecom Customer Churn
تفاصيل العمل
**Telecom Customer Churn Prediction**
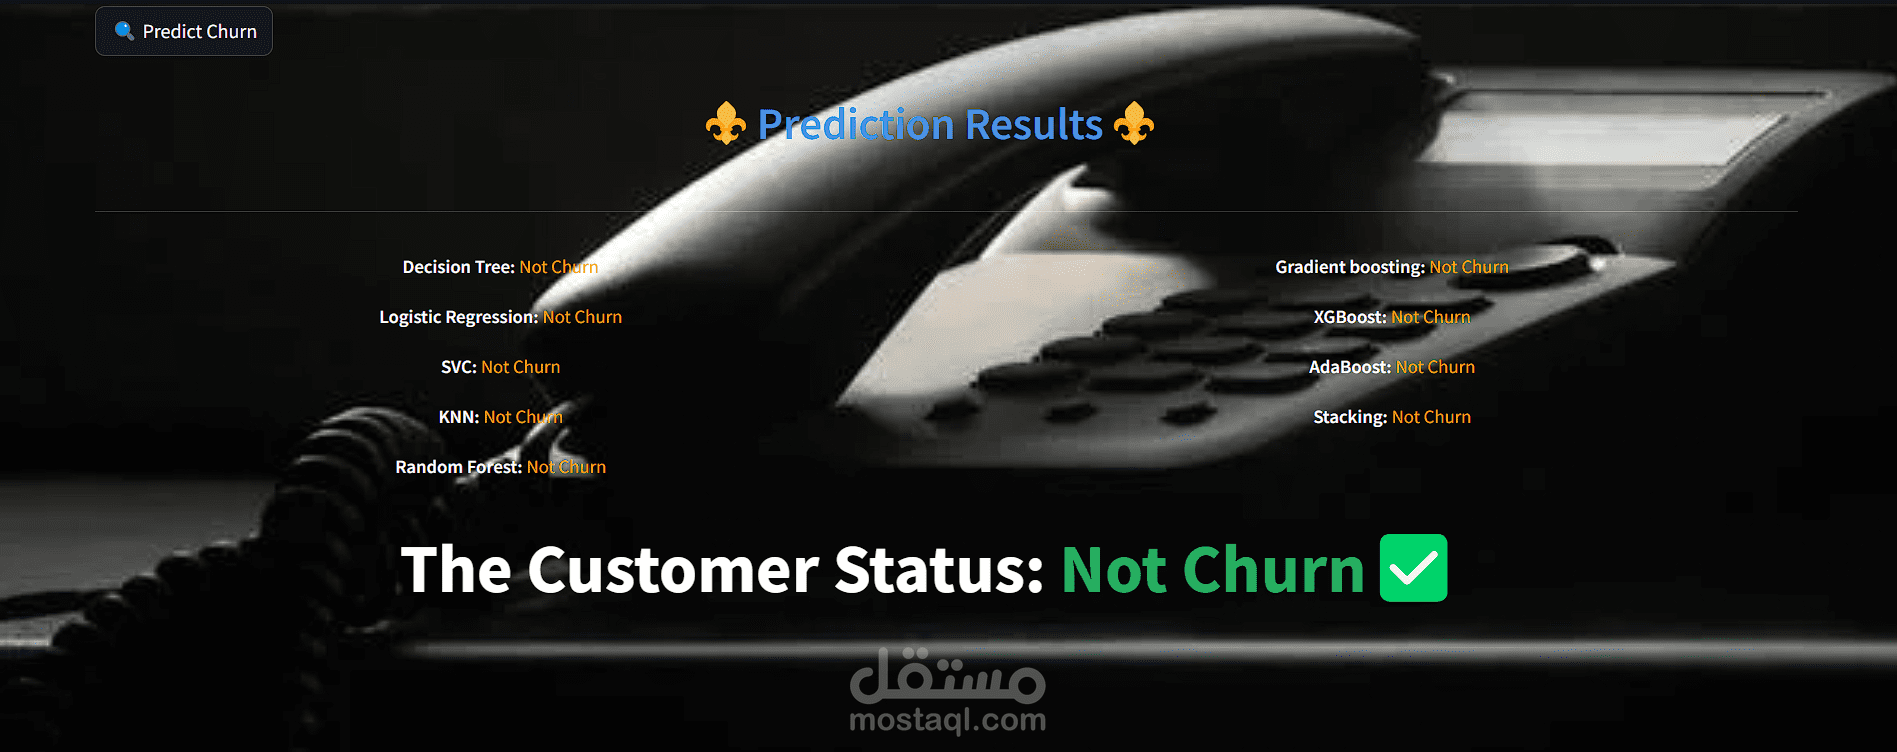
This project aims to analyze and predict customer churn in the telecom industry. The project involves data analysis, preprocessing, building machine learning models, and creating an interactive dashboard for visualizing insights. The final model is deployed using Streamlit to make the results accessible and interactive for stakeholders.
**Project Overview**
Customer churn prediction is crucial for telecom companies to identify customers likely to leave their services, allowing for retention strategies. In this project, we used historical customer data, performed data cleaning and analysis, built predictive models, and deployed an interactive dashboard.
**Project Steps**
1- Data Analysis and Preprocessing:
- Cleaned and processed data for missing values, outliers, and feature scaling.
- Conducted exploratory data analysis (EDA) to uncover trends and patterns.
2- Model Building:
- Split the data into training and testing sets.
- Built and evaluated several classification models (e.g., Logistic Regression, Random Forest, XGBoost).
- Selected the best-performing model based on accuracy, precision, recall, and F1 score.
3- Model Deployment:
- Developed a Streamlit dashboard for visualizing churn predictions and insights.
- Provided interactive features for stakeholders to explore data and prediction results.
**Features**
1- Data Analysis:
- Visualize customer demographics, usage patterns, and churn rates.
2- Model Predictions:
- Predict churn probability for individual customers.
- Explore key features influencing customer churn.
3- Interactive Dashboard:
- Simple and interactive interface for users to upload new customer data and get predictions.
**Programming Languages and Tools**
Programming Languages:
- Python
Frameworks/Tools:
- Scikit-learn: For implementing machine learning models.
- Pandas & NumPy: For data manipulation and analysis.
- Matplotlib, Seaborn & Plotly: For creating visualizations.
- Streamlit: For deploying interactive web applications.
- Power BI: For creating interactive dashboards.
- GitHub: For hosting the Streamlit page.
- Kaggle: For data collection.
- Canva: For presentation design.
ملفات مرفقة
بطاقة العمل
| اسم المستقل | Abdelrahman M. |
| عدد الإعجابات | 0 |
| عدد المشاهدات | 8 |
| تاريخ الإضافة | |
| تاريخ الإنجاز |
