Sales Performance Dashboard
تفاصيل العمل
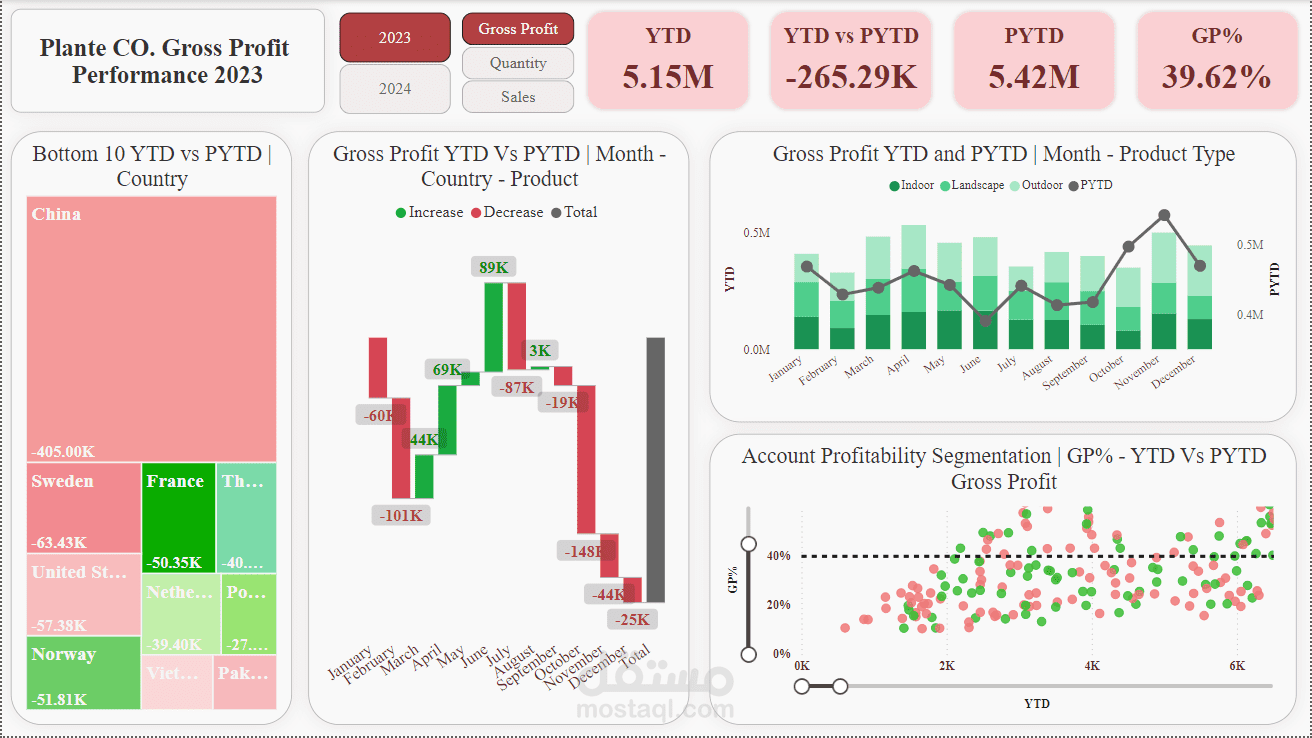
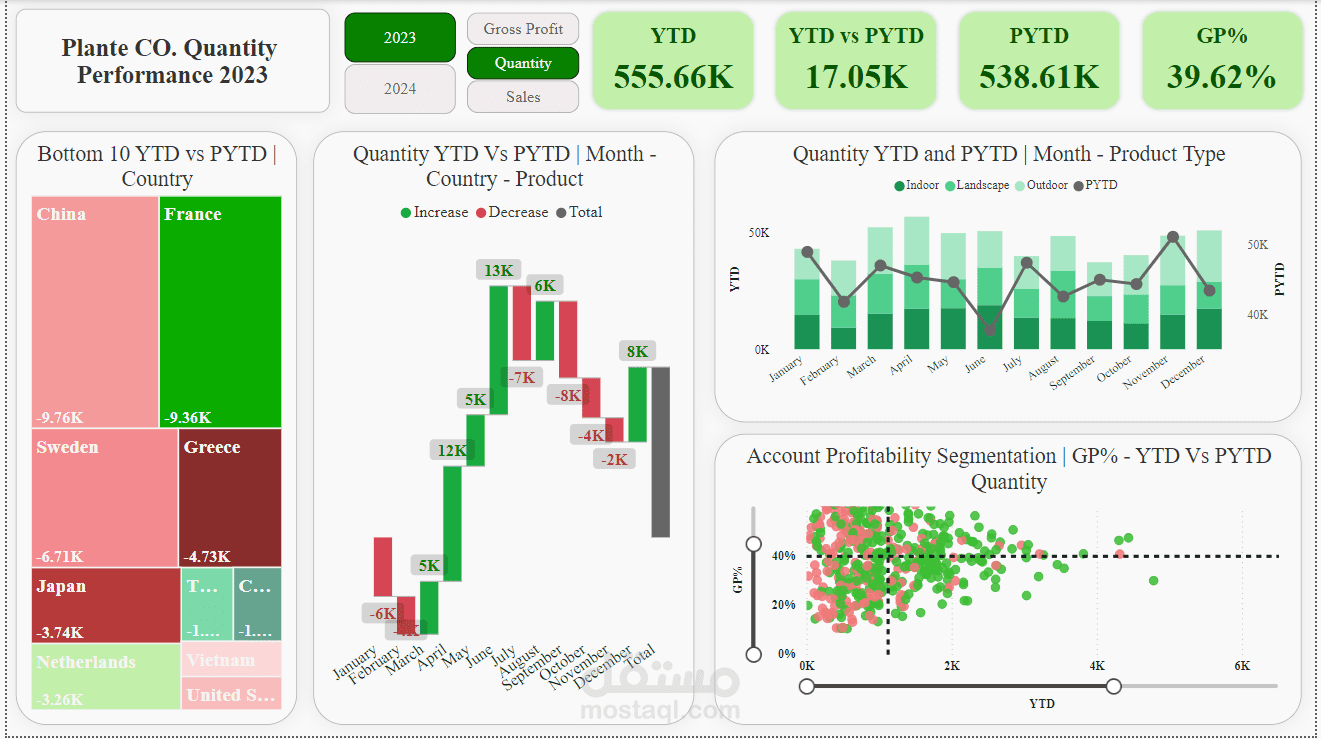
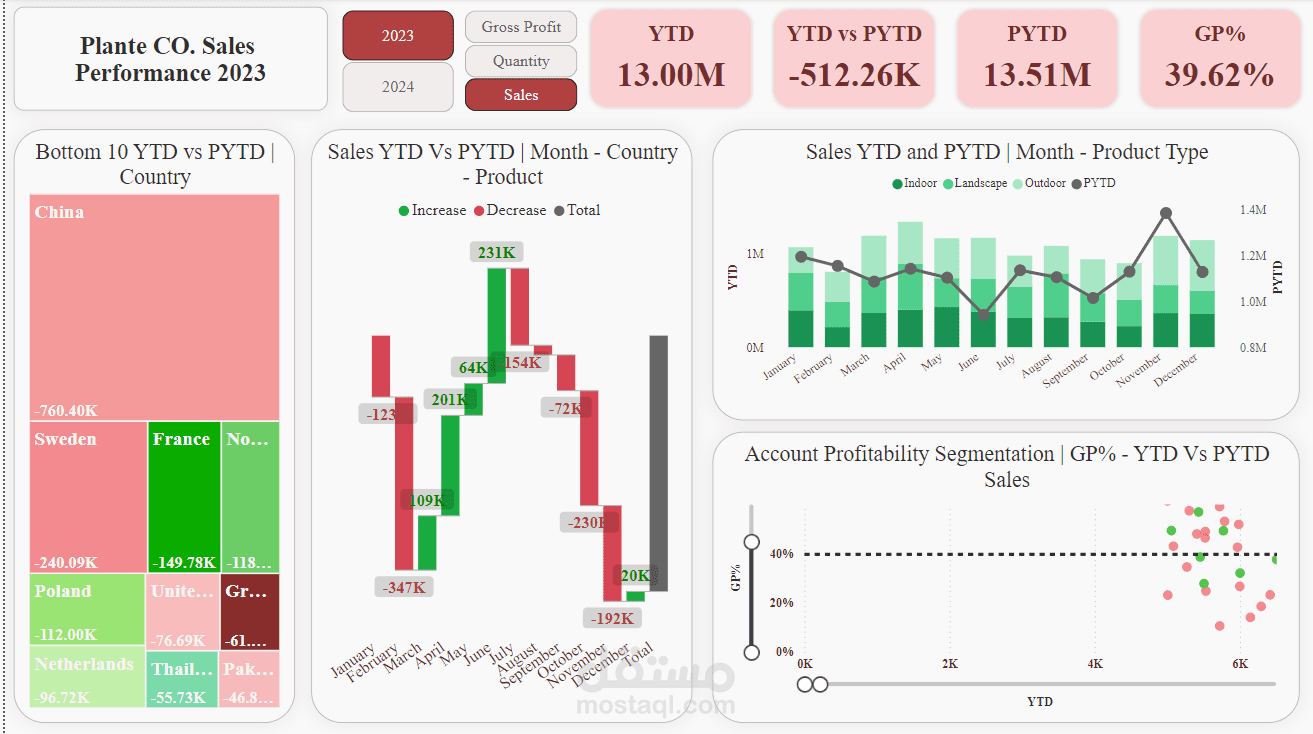
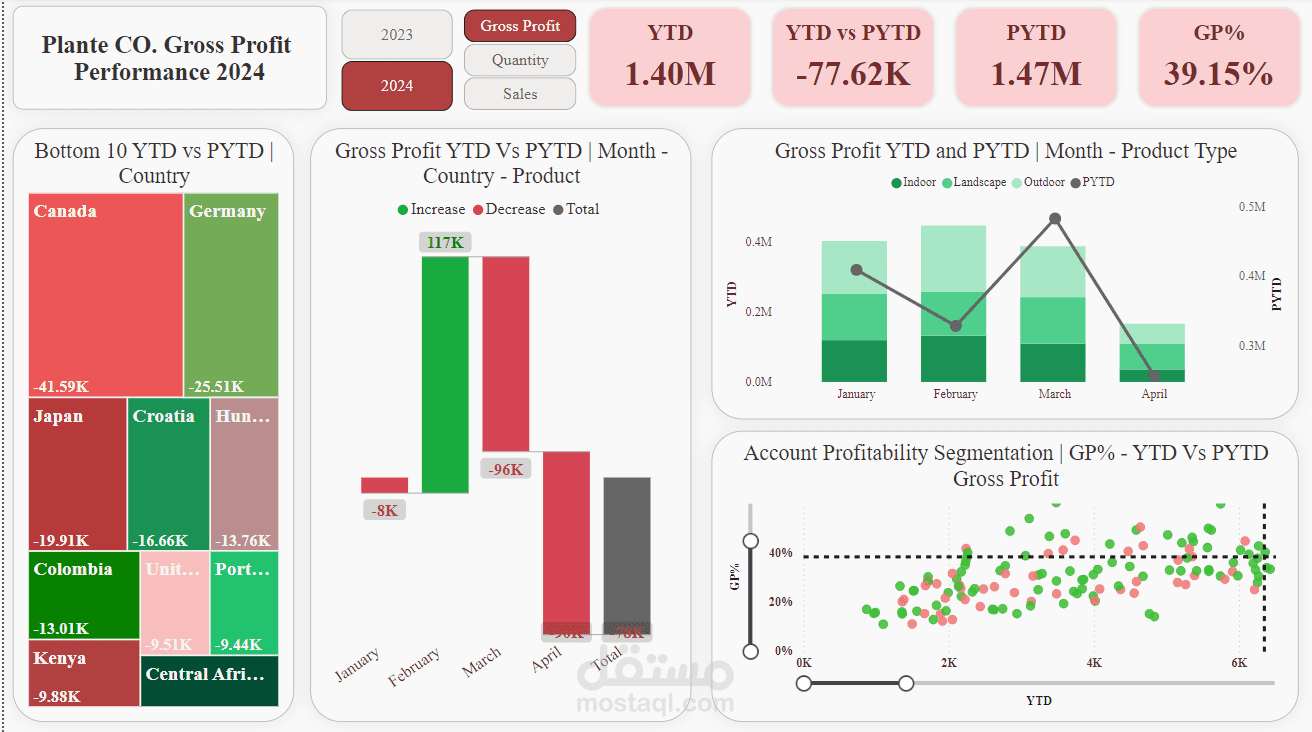
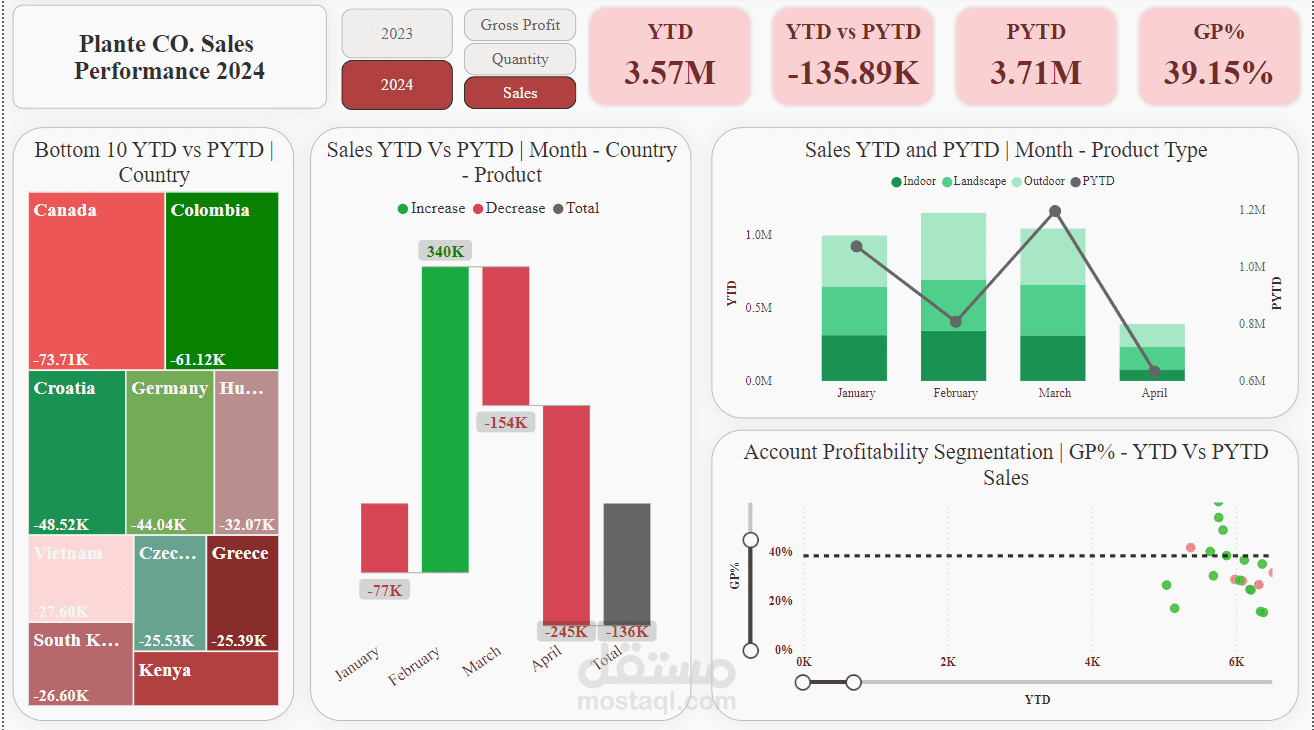
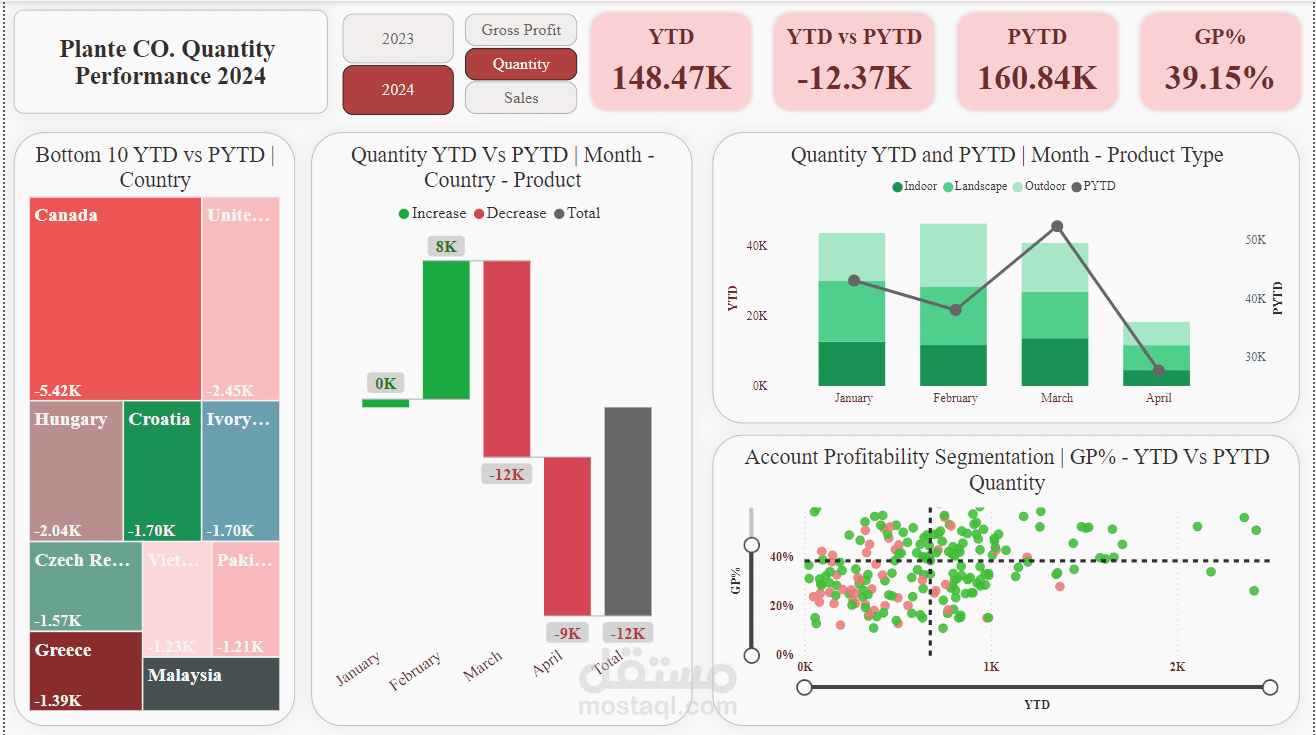
Created a Sales Performance Dashboard using DAX and Power BI that provides in-depth analysis of Plant Co.'s sales and gross profit trends for 2023 and 2024. This interactive dashboard highlights year-to-date (YTD) performance compared to the prior year (PYTD), enabling data-driven decision-making.
Key Metrics:
2023 Performance:
- Gross Profit Change: -$265.29K (YTD vs PYTD)
- Quantity Change: +17.05K units (YTD vs PYTD)
- Sales Change: -$512.26K (YTD vs PYTD)
2024 Performance:
- Gross Profit Change: -$77.62K (YTD vs PYTD)
- Quantity Change: -12.37K units (YTD vs PYTD)
- Sales Change: -$135.89K (YTD vs PYTD)
The dashboard facilitates a thorough examination of sales and profit trends, allowing stakeholders to track performance across different countries and product categories (indoor, landscape, and outdoor).
With the ability to explore specific metrics, users can identify opportunities for growth and areas requiring strategic adjustments. This project emphasizes the importance of monitoring gross profit and sales performance, providing stakeholders with critical insights to improve overall profitability and inform future business strategies.
ملفات مرفقة
بطاقة العمل
| اسم المستقل | Haneen H. |
| عدد الإعجابات | 0 |
| عدد المشاهدات | 11 |
| تاريخ الإضافة | |
| تاريخ الإنجاز |
