Olympic History Analysis Dashboard
تفاصيل العمل
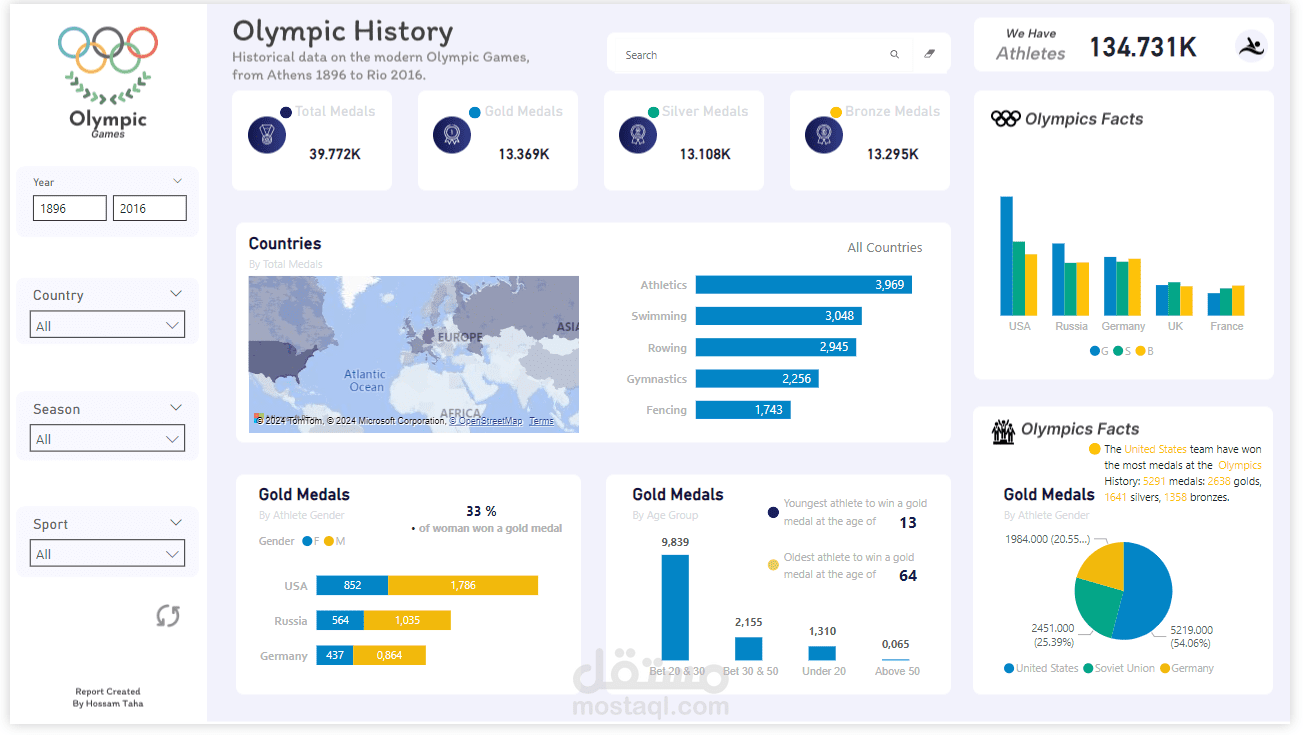
An interactive Power BI dashboard analyzing the history of the modern Olympic Games from 1896 to 2016. The dashboard provides insights into medal counts, athlete demographics, and country performance, with filters for year, country, season, and sport. It highlights trends in gender representation, age of athletes, and showcases unique Olympic records. This project demonstrates my skills in data visualization and storytelling through historical sports data.