Pizza Sales Analysis
تفاصيل العمل
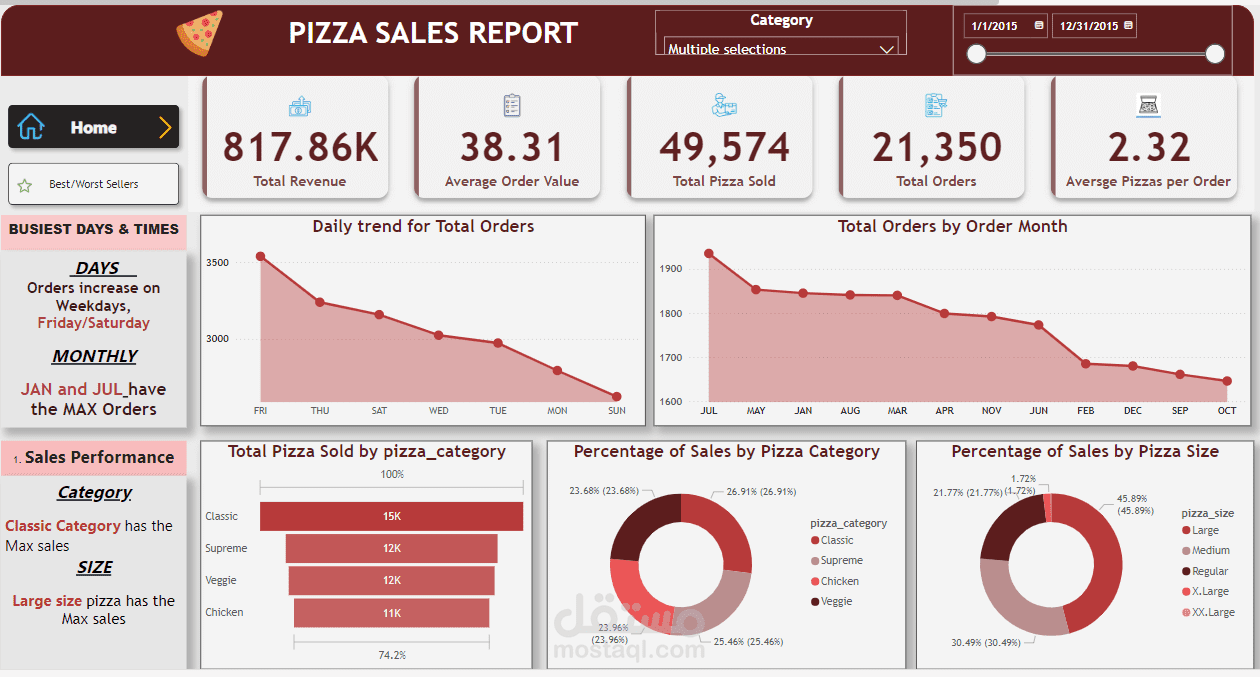
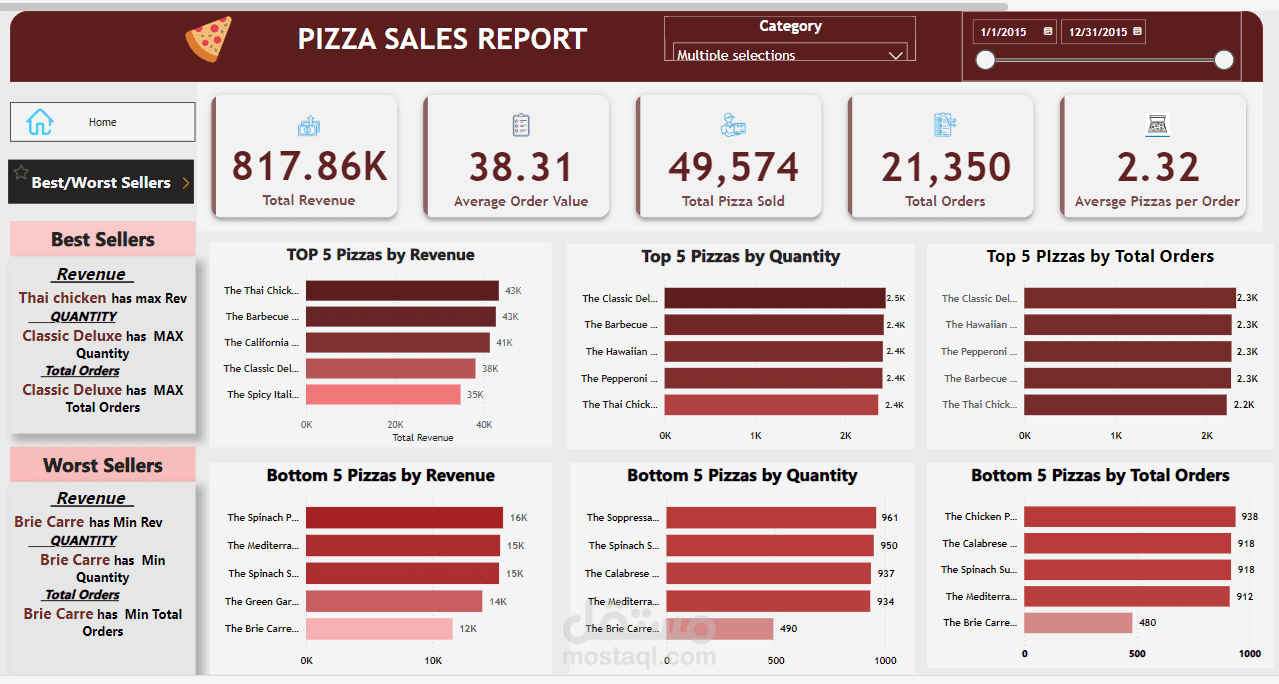
The goal of this project is to analyze pizza sales data to uncover customer preferances and sales trends . The power BI dashboard provides data-driven insights to improve promotions ,optimize menu and increase revenue
Key Findings
Peak Sales: Fridays and Saturdays accounted for 40% of total orders, with peak daily sales reaching 1,200 units.Top-Selling Product: The Thai Chicken pizza consistently outperformed other menu items in terms of revenue.Seasonal Fluctuations: July and January experienced the highest demand, indicating potential seasonal trends.Customer Preferences: Classic pizza styles were the most popular, with a strong preference for larger sizes.Menu Optimization: The top five best-selling pizzas accounted for 70% of total revenue, highlighting the need to reassess the performance of underperforming items.
بطاقة العمل
| اسم المستقل | عبدالله ر. |
| عدد الإعجابات | 0 |
| عدد المشاهدات | 4 |
| تاريخ الإضافة |


