Zomato Restaurant Industry Data Analysis
تفاصيل العمل
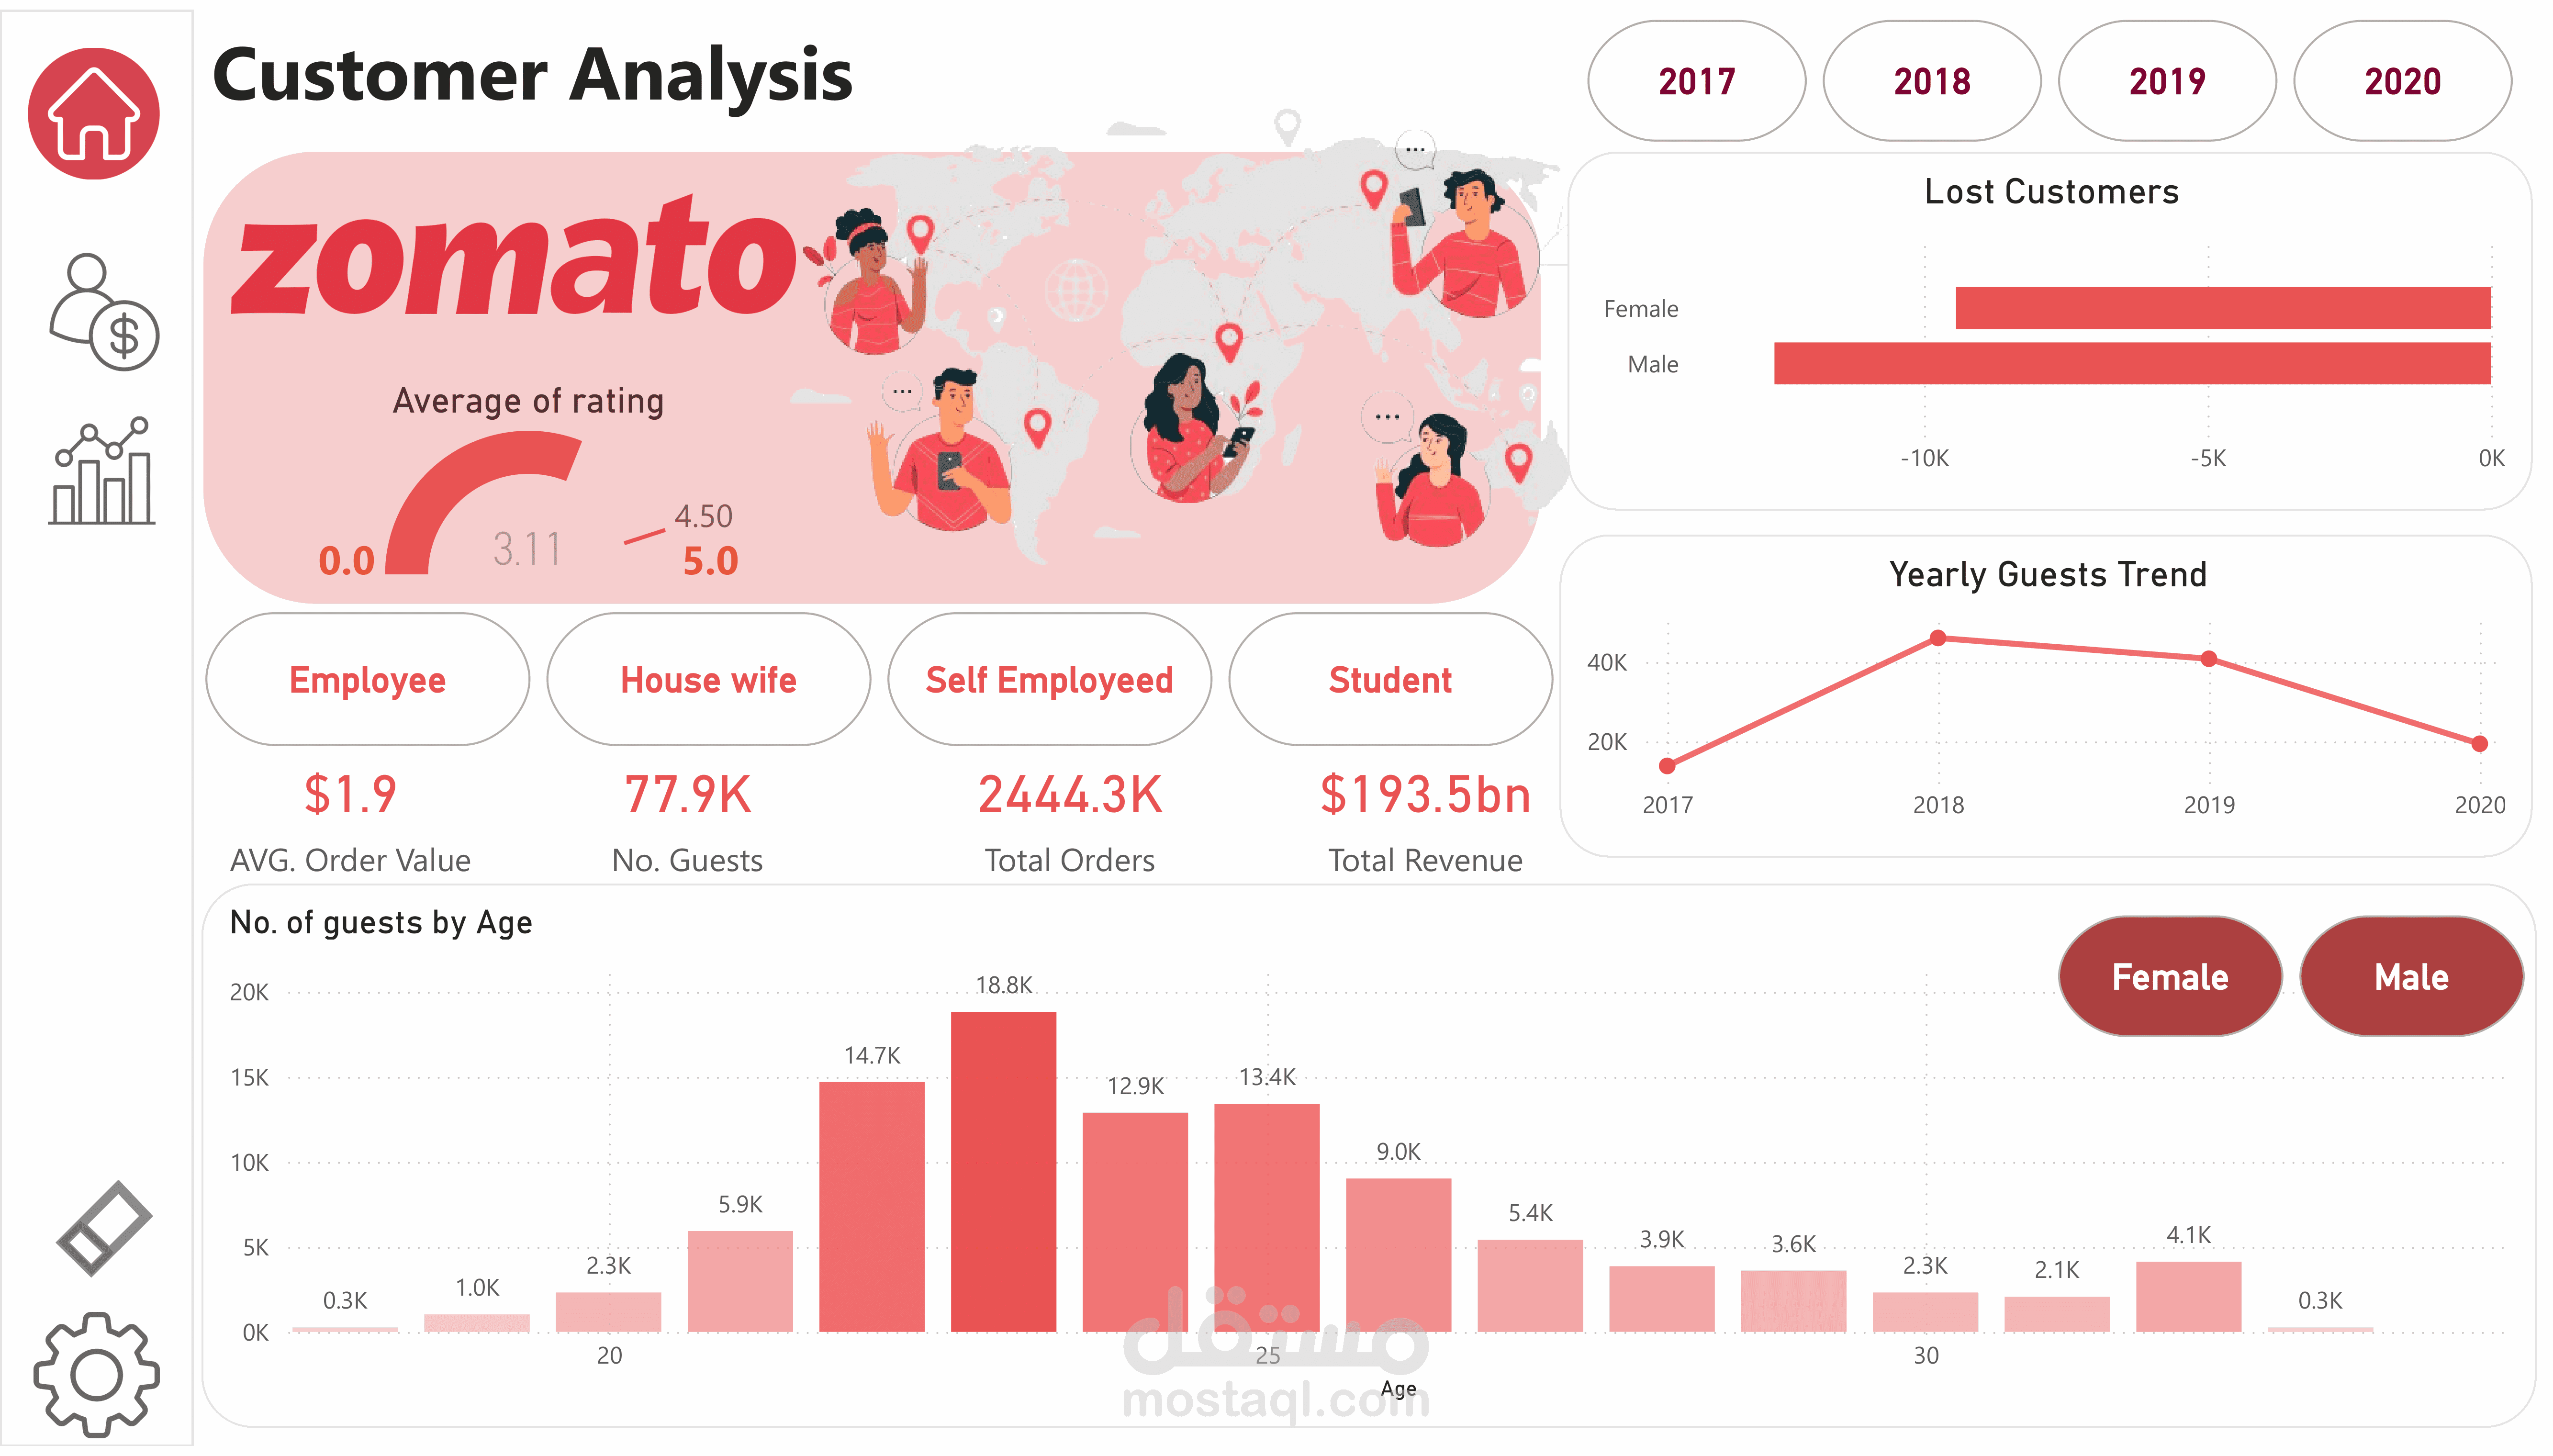
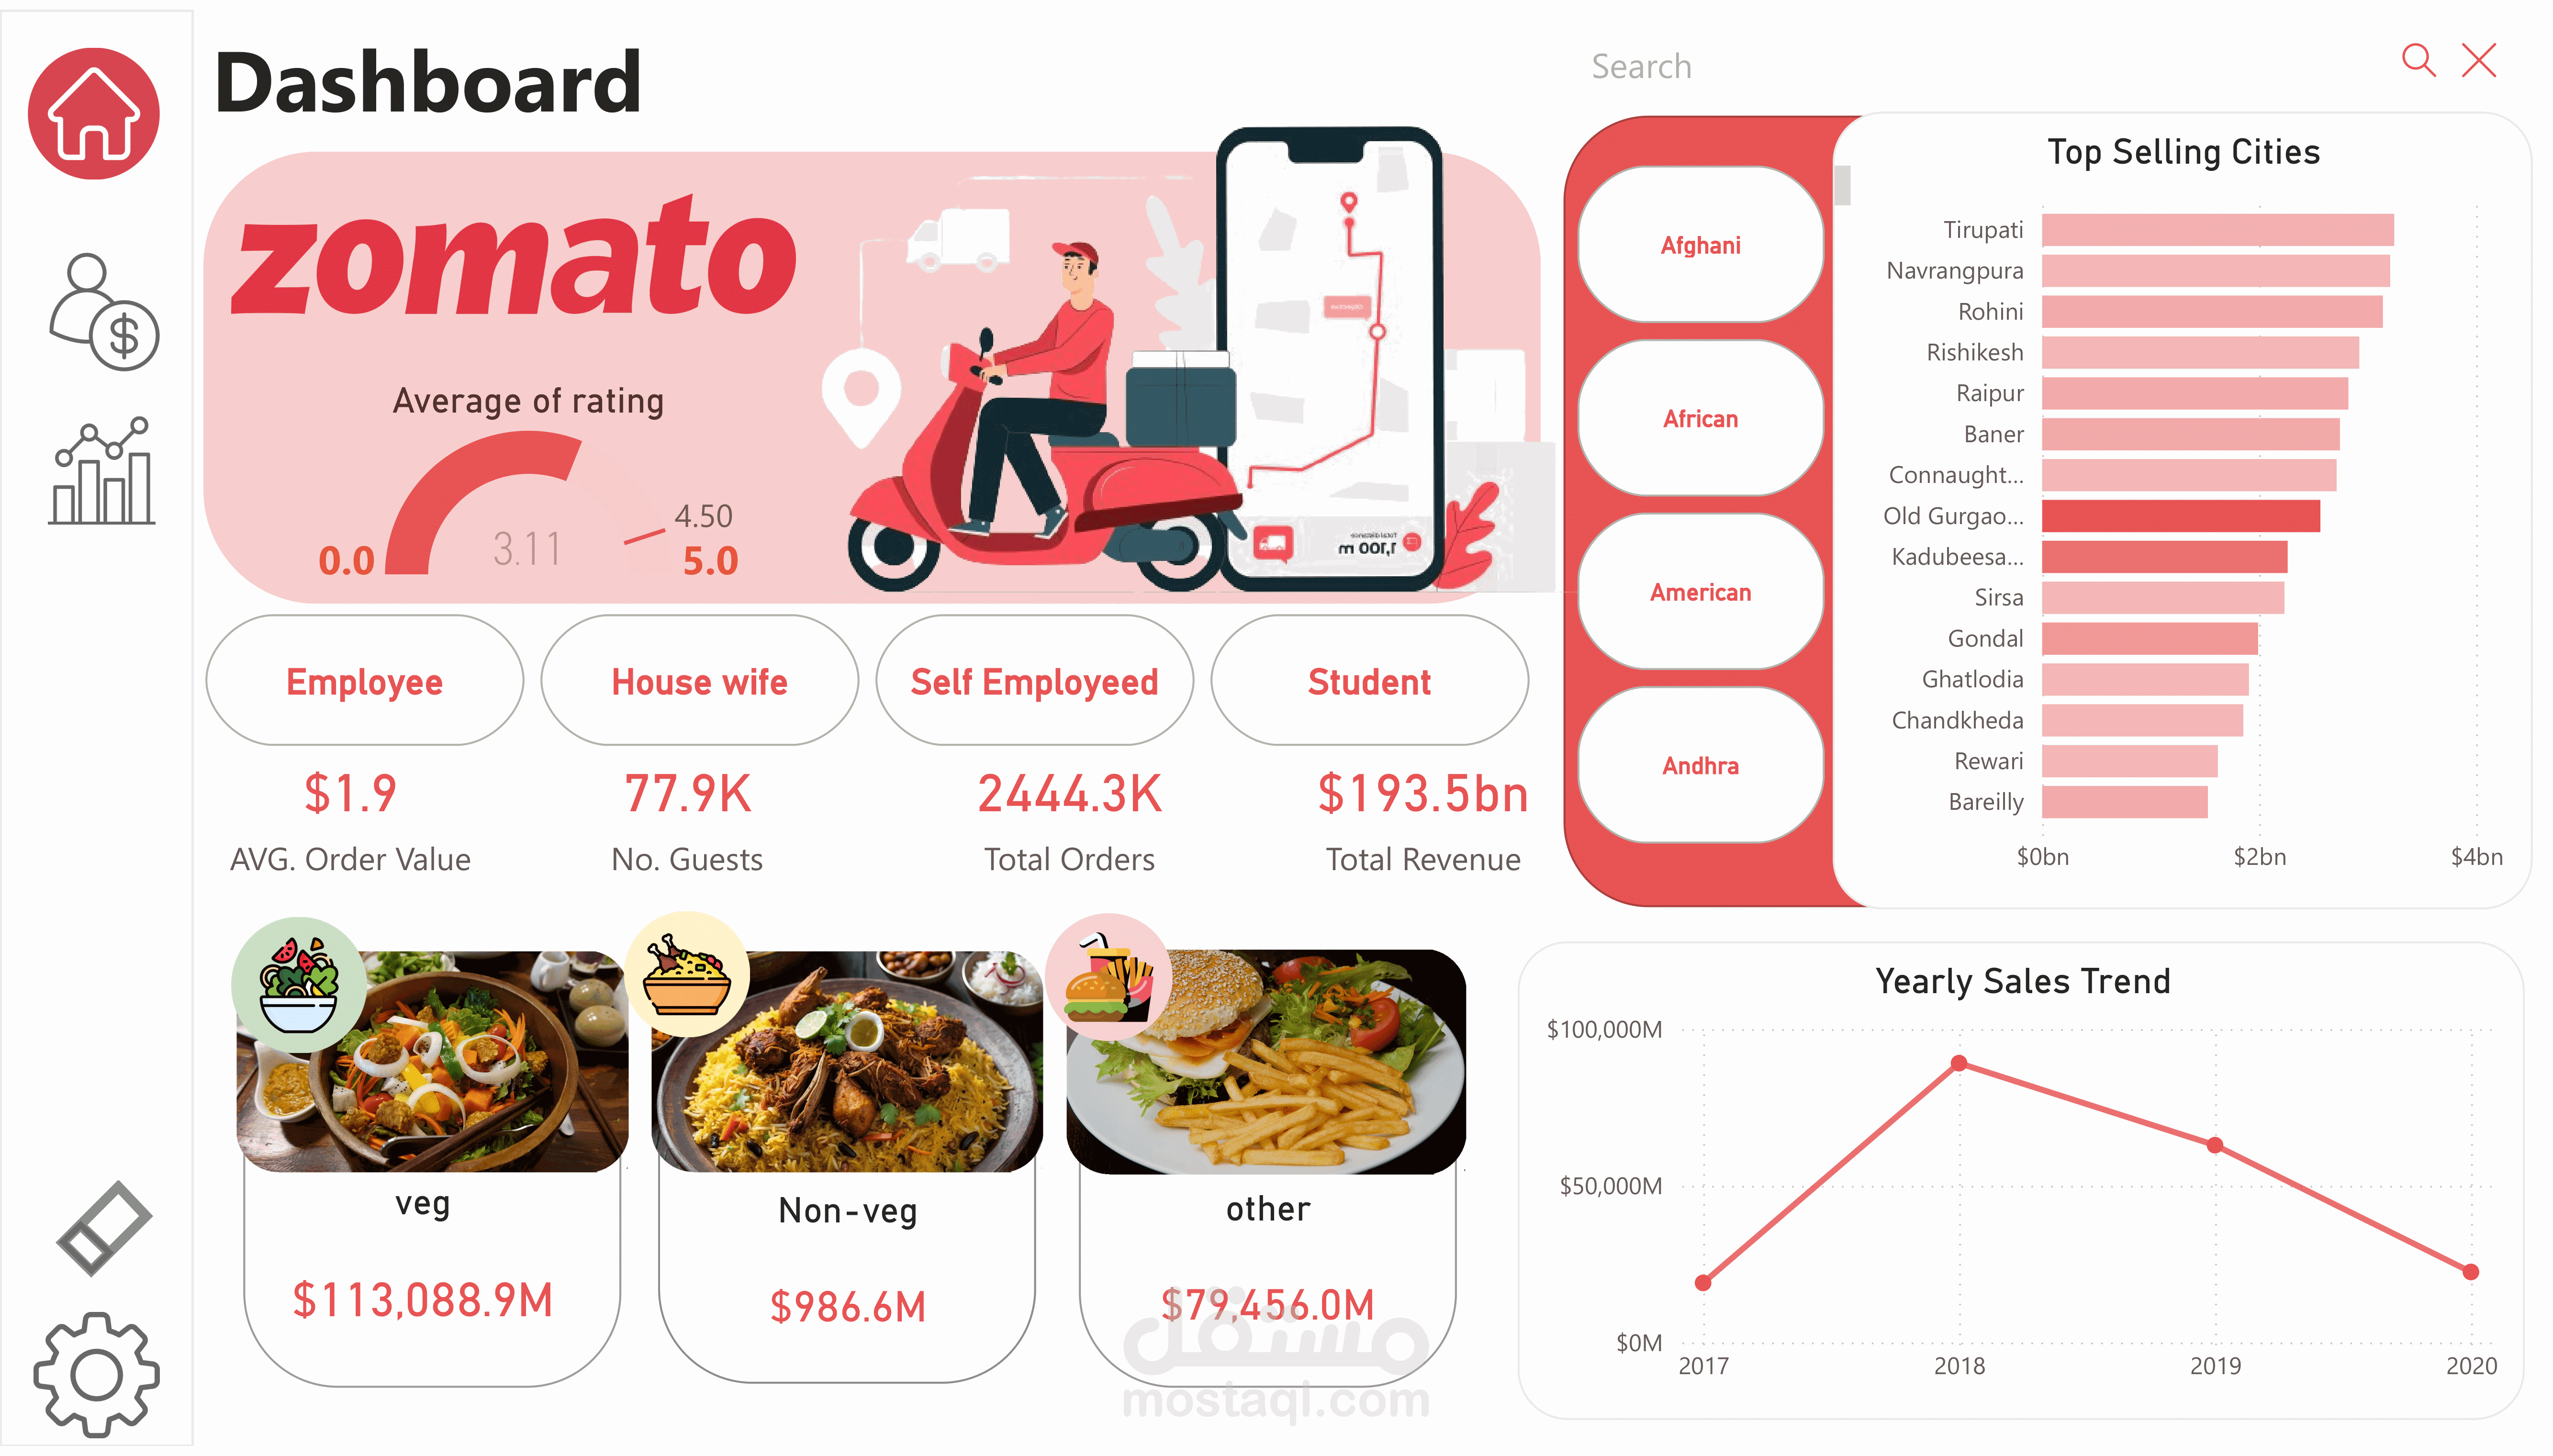
This project involved a comprehensive analysis of restaurant sales trends, customer demographics, and behavioral insights. Utilizing advanced data visualization tools like Power BI, I processed and analyzed data from 2444.3K orders and $193.5 billion in revenue, uncovering valuable insights into customer preferences and restaurant performance.
Key highlights:
Sales Trends: Analyzed yearly sales across multiple cities, identifying top-performing locations such as Tirupati and Connaught Place.
Customer Behavior: Explored gender-based preferences, average order values, and customer satisfaction across various age groups.
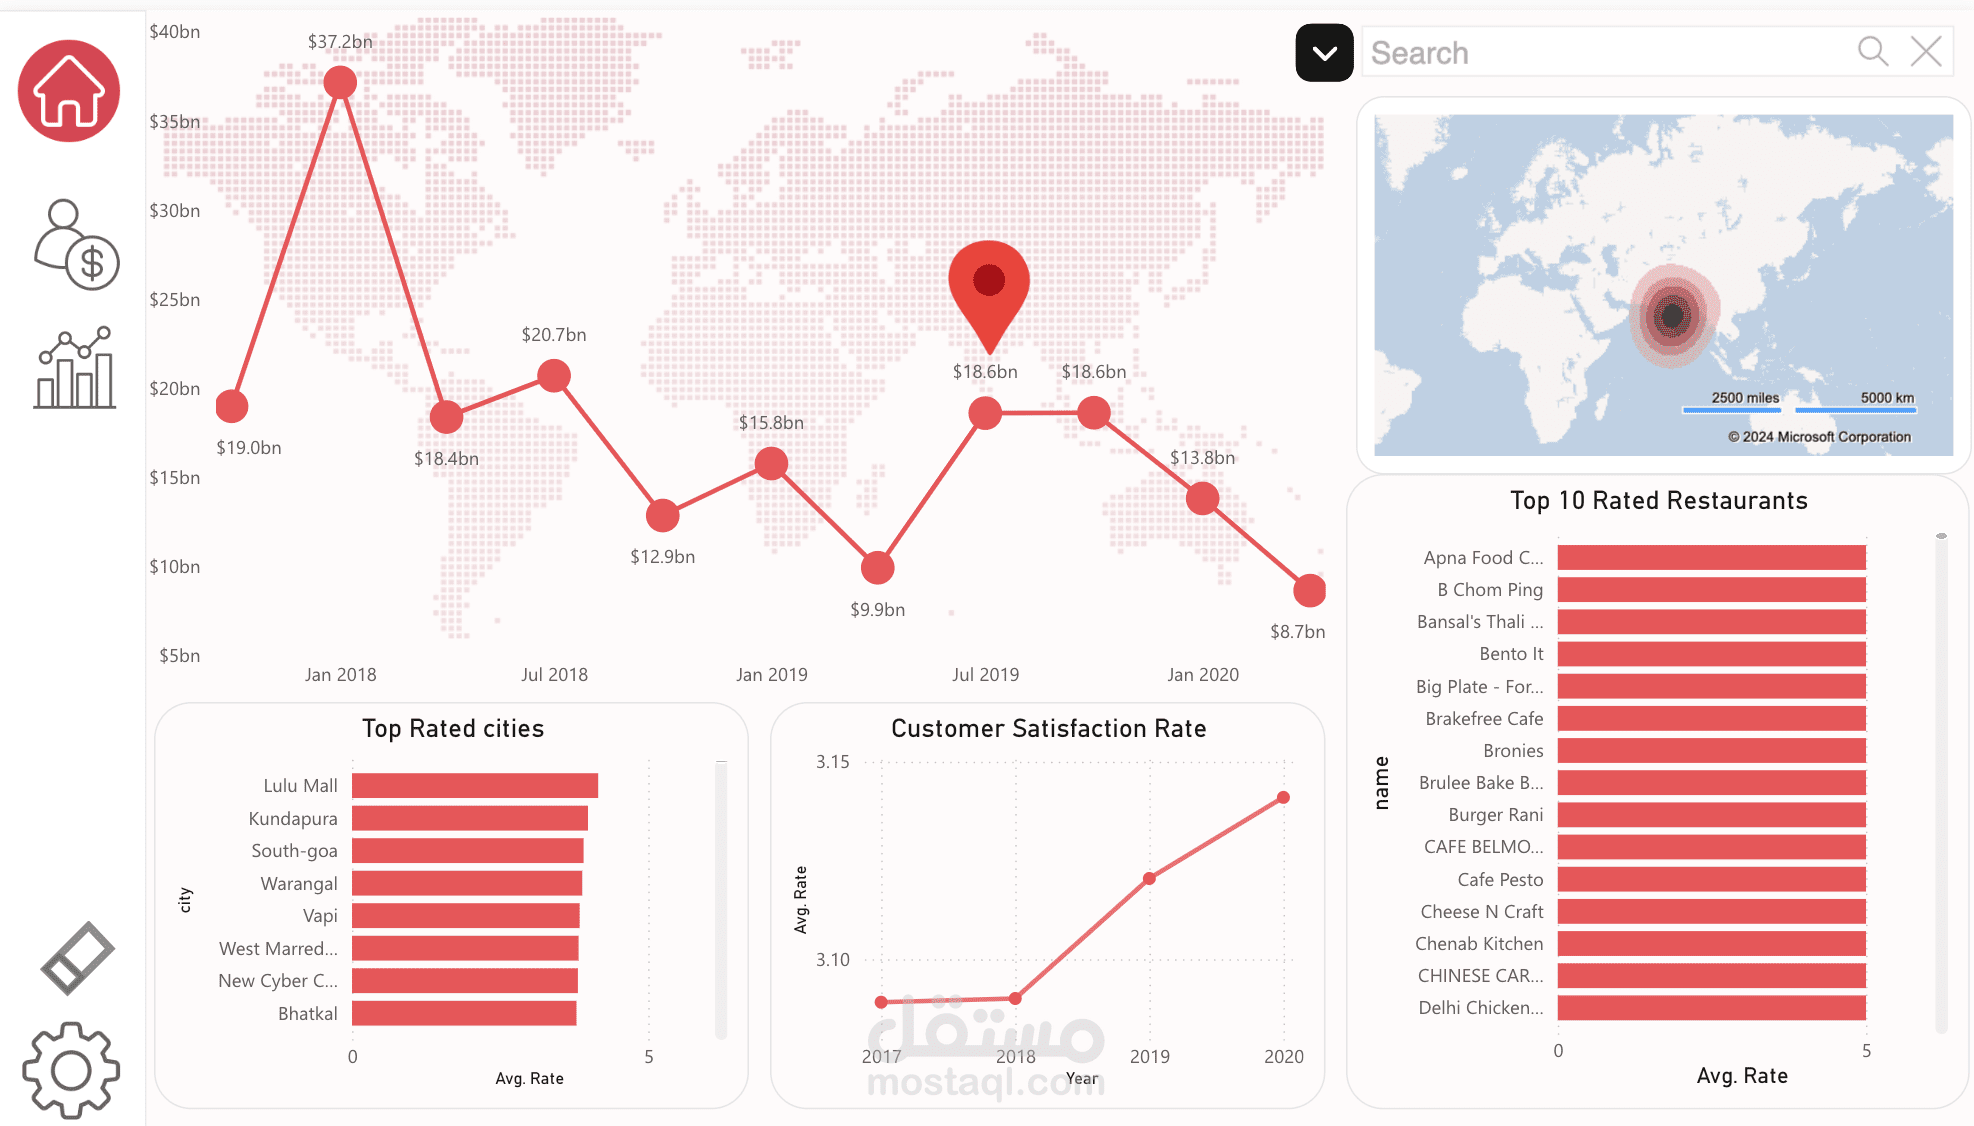
Revenue Analysis: Tracked monthly revenue fluctuations to pinpoint opportunities for business optimization.
This project showcases my ability to leverage data analytics to drive business insights and inform strategic decision-making within the restaurant industry.
Tools: Power BI, Excel, Data Visualization, Business Intelligence


