AdventureWorks Sales Dashboard
تفاصيل العمل
Description
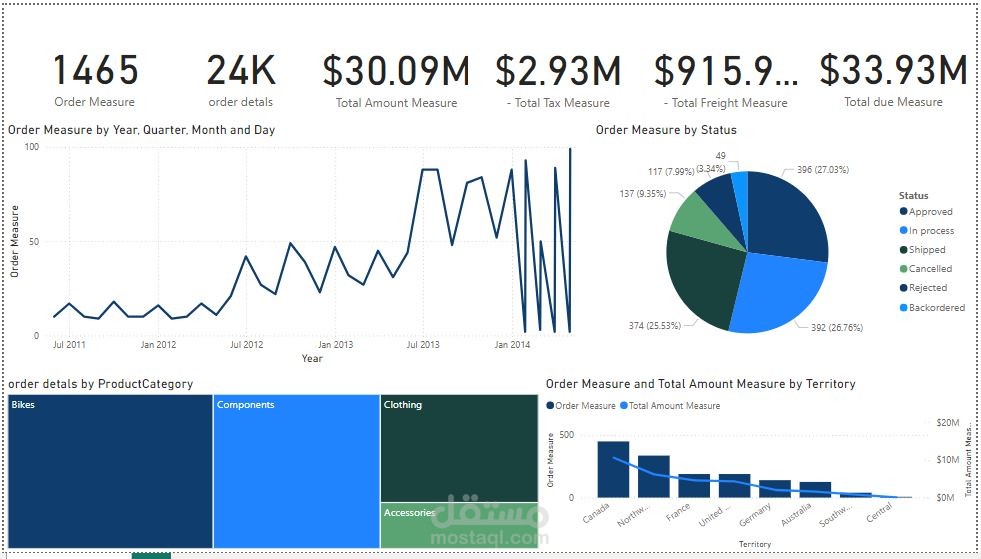
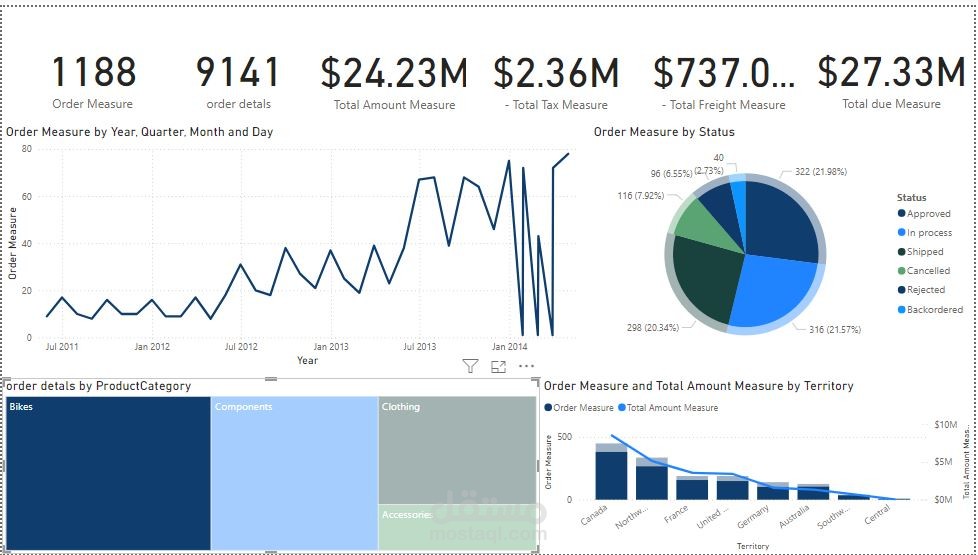
This project involves creating a comprehensive sales dashboard for AdventureWorks using data from Sales.xlsx. The dashboard includes various visualizations and measures to provide insights into sales performance.
Visual Content
Visual content plays a crucial role in communication, storytelling, and marketing. It encompasses various forms such as images, videos, infographics, and animations. Effective visual content can capture attention, convey complex information quickly, and evoke emotions. When creating visual content, consider the following key elements:
Clarity: Ensure your visuals are clear and easy to understand.
Relevance: Use visuals that are relevant to your message and audience.
Aesthetics: Pay attention to design principles like color, balance, and contrast.
Consistency: Maintain a consistent style and theme across all visual content.
Accessibility: Make sure your visuals are accessible to all users, including those with disabilities.
By focusing on these elements, you can create compelling visual content that effectively communicates your message and engages your audience.
Project Details
Data Source
Sales.xlsx
Modeling
Product Hierarchy
Measures
I created several measures to provide detailed insights into the sales data:
# Orders Measure
# Order Details Measure
Total SubTotal Measure
Total Tax Measure
Total Freight Measure
Total Due Measure
DAX Measures Table
A DAX Measures table was created to contain all the measures listed above.
Visuals
Using the measures, I created the following visuals:
Drill Down
Tooltip
# Orders Card
# Order Details Card
Total SubTotal Card
Total Tax Card
Total Freight Card
Total Due Card
# Orders by OrderDate
# Orders by Status
# Orders by Category, SubCategory, Product
# Orders vs. TotalDue by Territory
Design
I ensured good colors, layout, and meaningful chart titles to enhance the dashboard's readability and aesthetic appeal.
Installation
Instructions on how to install and set up your project.
Usage
Instructions on how to use your project.
Contributing
Guidelines for contributing to your project.
Conclusion
This project demonstrates the power of visual content in analyzing and presenting sales data. By leveraging various measures and visualizations, the dashboard provides valuable insights into sales performance,helping stakeholders make informed decisions. The focus on clarity, relevance, aesthetics, consistency, accessibility ensures that the visual content is both effective and engaging.