GUI Grade assist Python
تفاصيل العمل
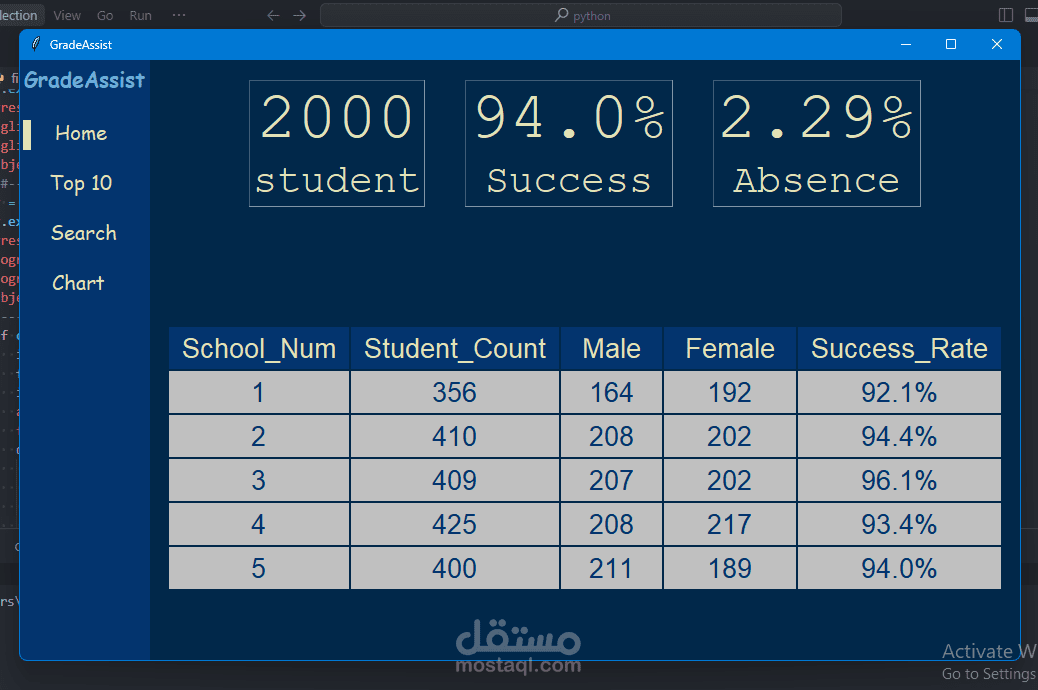
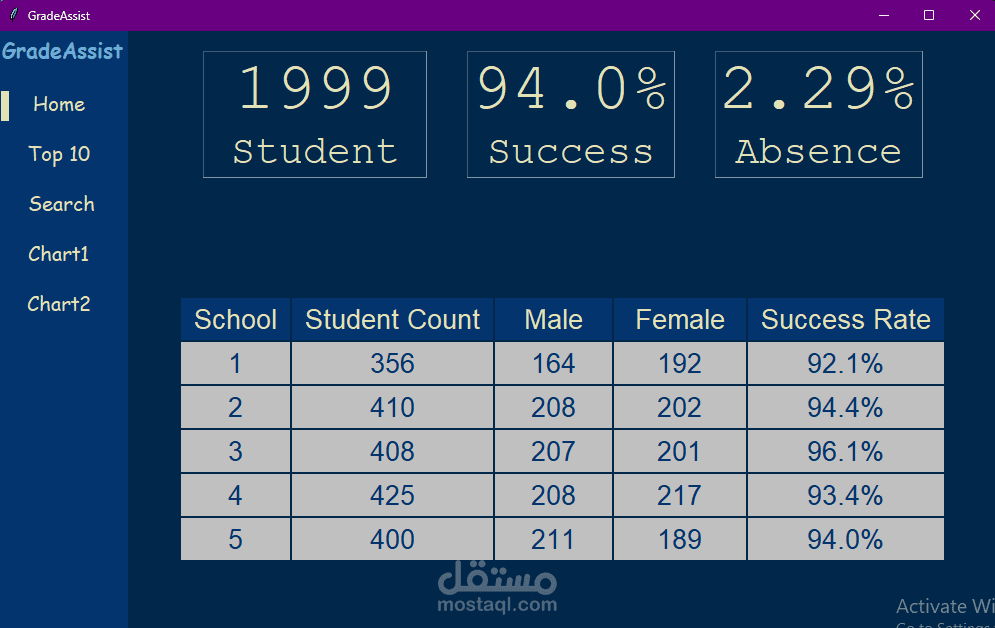
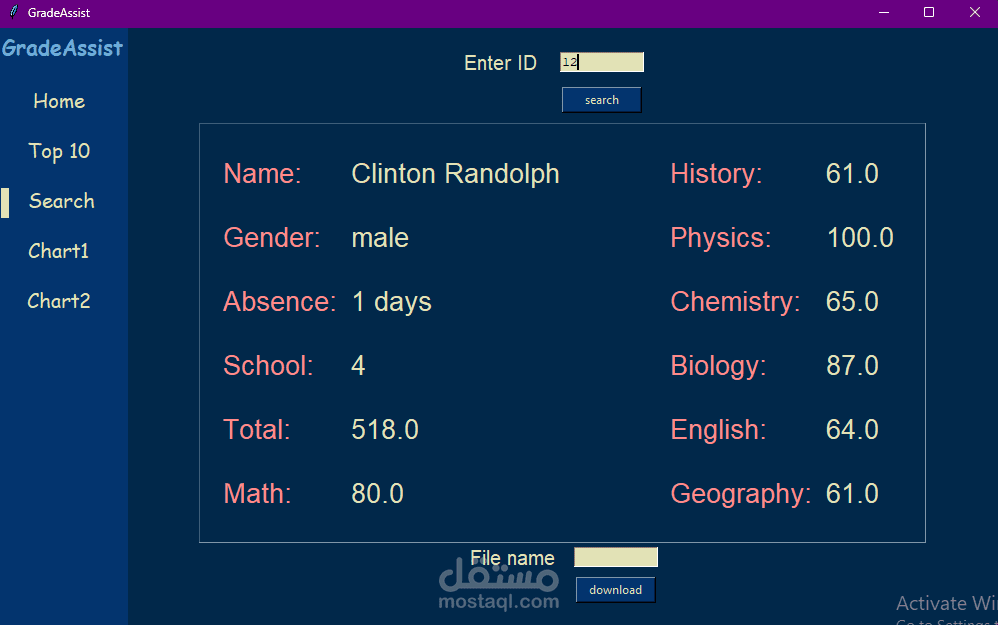
مشروع GradeAssist لتحليل بيانات الطلاب وتحديد الأنماط والاتجاهات الرئيسية. إليك كيفية بنائه:
- جمع البيانات: استخدمت Kaggle للحصول على ملف بيانات بصيغة CSV.
- استيراد البيانات: تم استيراد ملف CSV إلى SQL Server.
- فهم البيانات: تم تحليل المعلومات لاستخلاص الأفكار والرؤى.
- الربط بين SQL وPython: تم توصيل قاعدة البيانات بلغة Python لإجراء المزيد من التحليل.
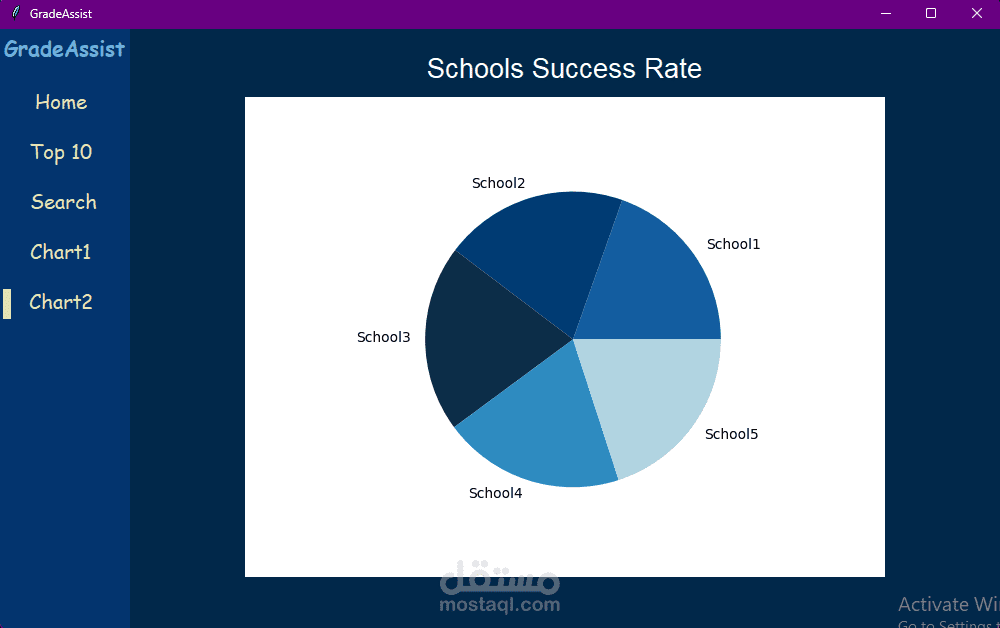
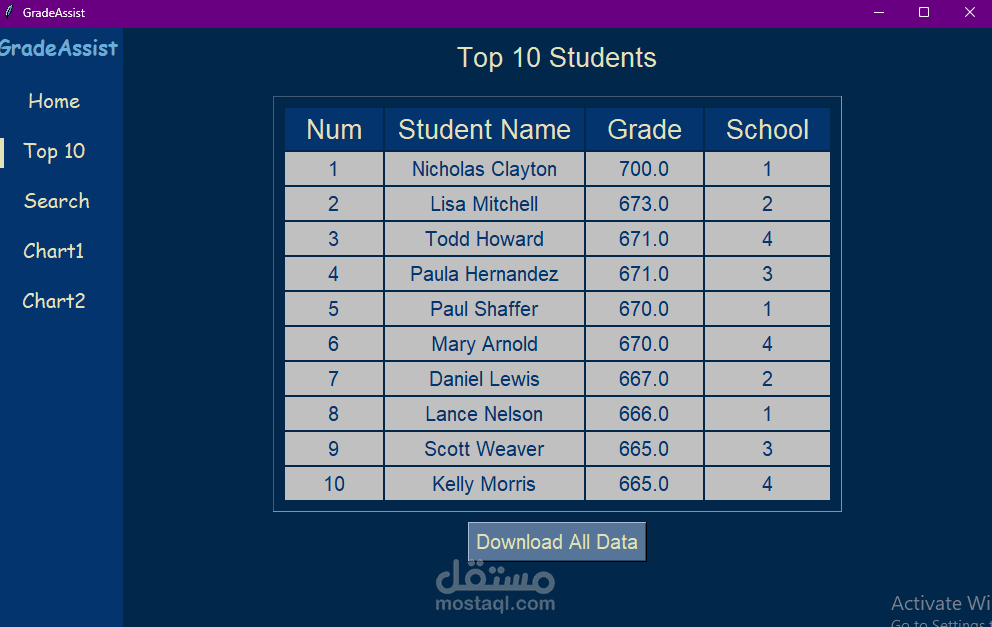
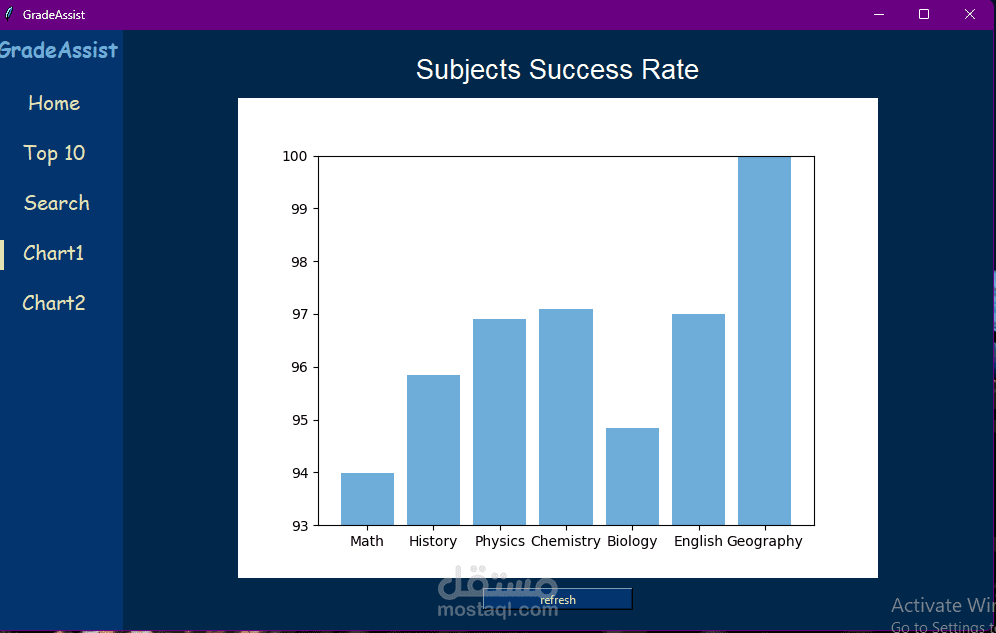
- تصوير البيانات: استخدمت Tkinter لعرض البيانات بفعالية.
التقنيات المستخدمة في GradeAssist:
1- Python: اللغة الأساسية لمعالجة البيانات.
2- Tkinter: لإنشاء واجهة مستخدم رسومية تفاعلية.
3- Matplotlib: لإجراء الحسابات الرياضية المتقدمة وإنشاء الرسوم البيانية.
4- Pandas: لحفظ البيانات في ملف Excel.
5- Pypyodbc: لتوصيل قاعدة البيانات بـ Python.
6- NumPy: لتحويل القوائم إلى مصفوفات لسهولة العمليات.
7- fpdf: لإنشاء تقارير بصيغة PDF