Crimes
تفاصيل العمل
Basically, this work is meant for studying crime data to find out important patterns, trends, and insights. In such a way, it will be possible to assess when and where crimes are more likely to occur, and who their victims may be. Finally, the results of such studies can be used by police departments in effective resource management, stopping crimes, and enhancing public safety plans.
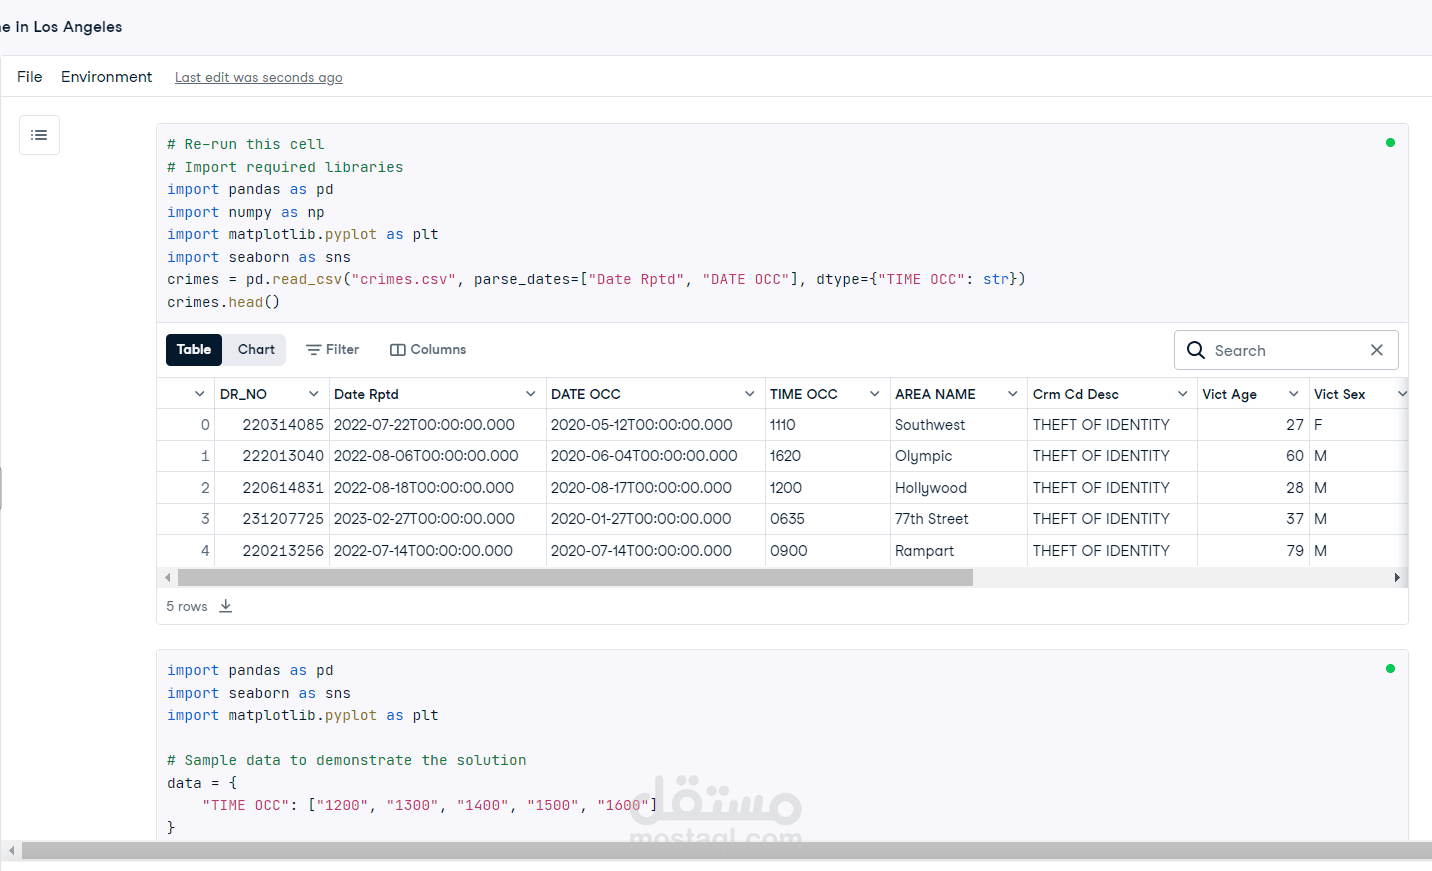
This would contain time, date, location, and details about victims that could be useful in finding patterns, such as the busiest times of crimes, places where crimes occur at night, or age groups of victims.
Main Points:
High Crime Times:
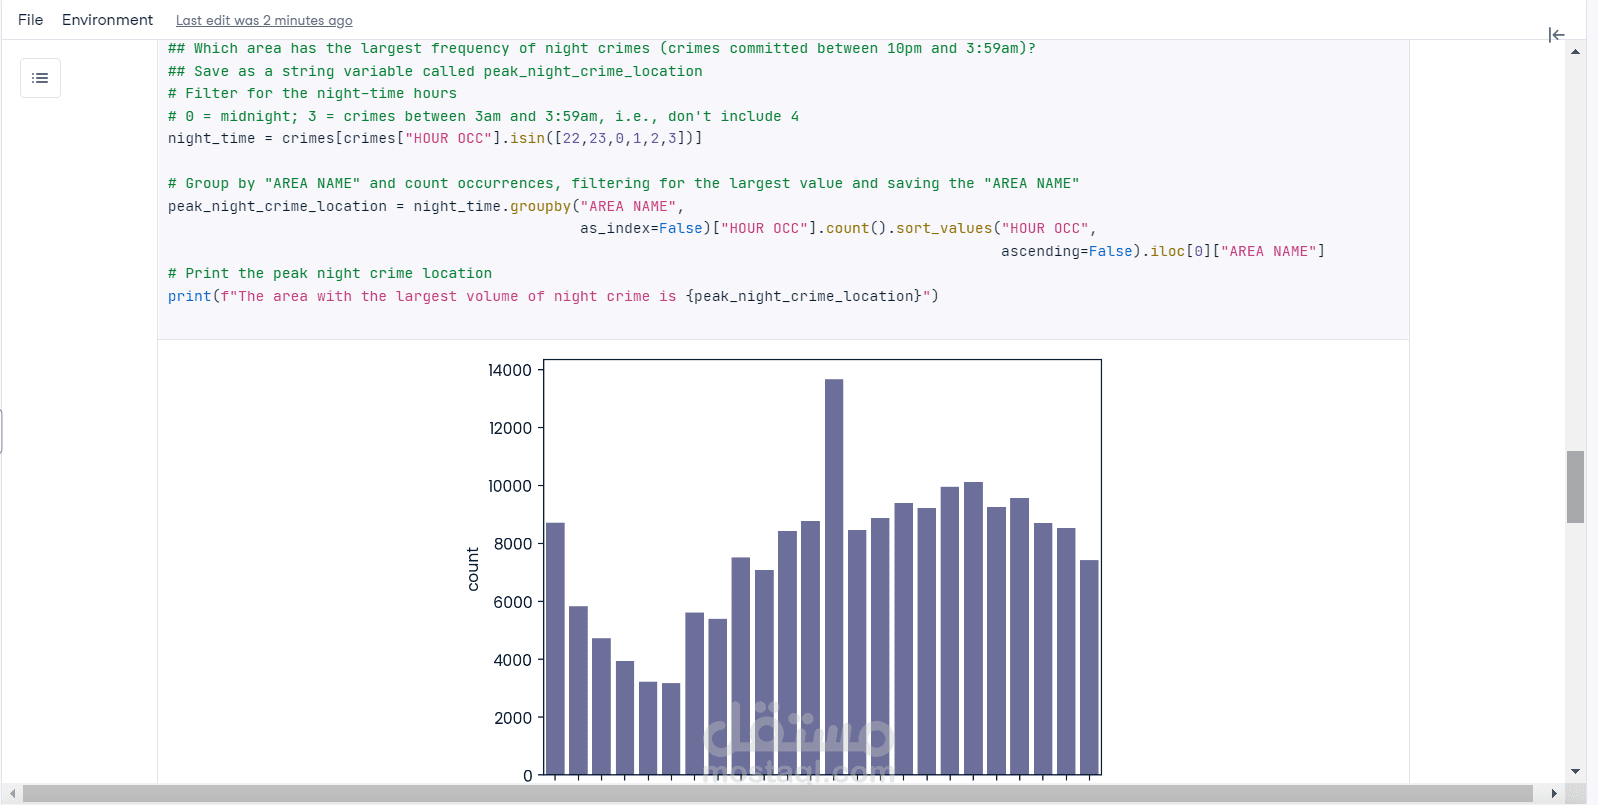
Of course, the most crimes, according to the project, occur at noon-that is, 12 o'clock.
A countplot showed how crime rates change by hour, highlighting at what time most crimes happen throughout the day.
Night-Time Crime Locations:
The crimes analyzed occurred between 10 PM and 3:59 AM. Grouping and sorting were done to identify which location had more nighttime crimes and print that for further investigation.
Age Group of Victims: The project binned victims into age ranges (0-17, 18-25, 26-34, etc.) with pd.cut(). A frequency analysis showed how many crimes happened to each age group. This highlights which groups of people are most affected by crime


