MD Water Service Dataset Analysis Using Power BI
تفاصيل العمل
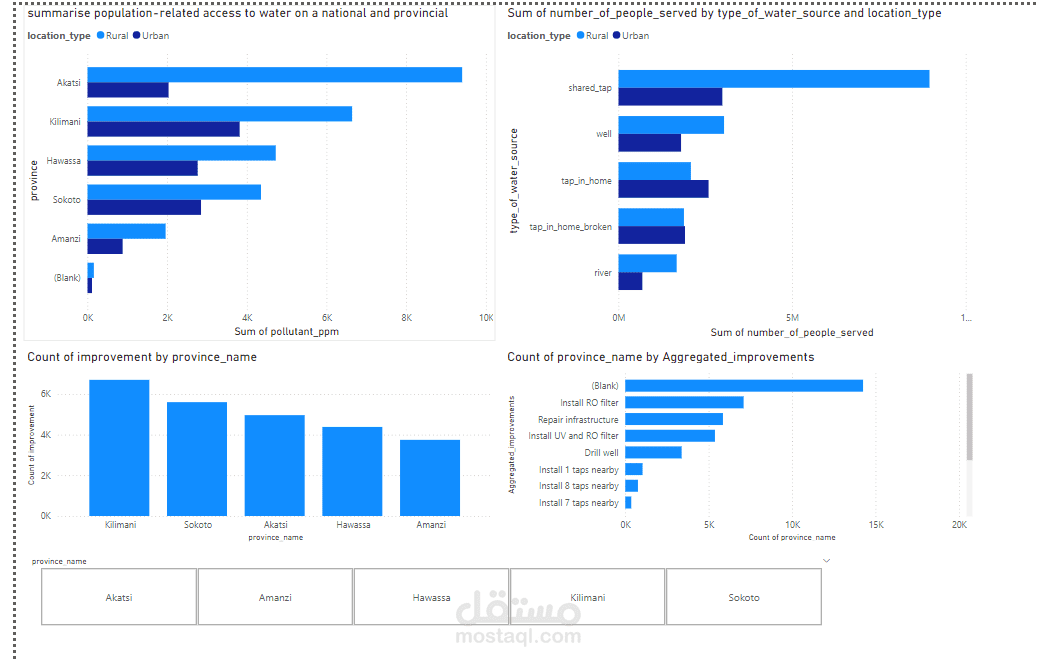
This Power BI dashboard offers a comprehensive analysis of the "MD Water Service" dataset, which consists of multiple interconnected tables. The dataset was cleaned and processed using Python, and includes the following key components:
Well Pollution: Insights into pollution levels across various wells, helping to identify areas requiring attention or remediation.
Water Source Related Crime: An overview of crimes related to water sources, offering a unique perspective on security issues within the water service domain.
Water Source: Detailed information about different water sources, including types and their locations.
Visits: Data on site visits for water source inspections, enabling tracking of maintenance and supervision activities.
Queue Composition: Analysis of the composition of queues at water service points, helping to optimize service delivery and reduce waiting times.
Infrastructure Cost: A breakdown of the costs associated with building and maintaining water infrastructure.
Location: Geographical data related to water sources and service points, allowing for spatial analysis of the system.
Project Progress: Tracking the status and progress of various water service projects, offering insights into timelines and completion rates.
The dashboard allows users to explore the relationships between these factors, uncover trends, and make informed decisions to improve water service management.
