Titanic analysis dash board
تفاصيل العمل
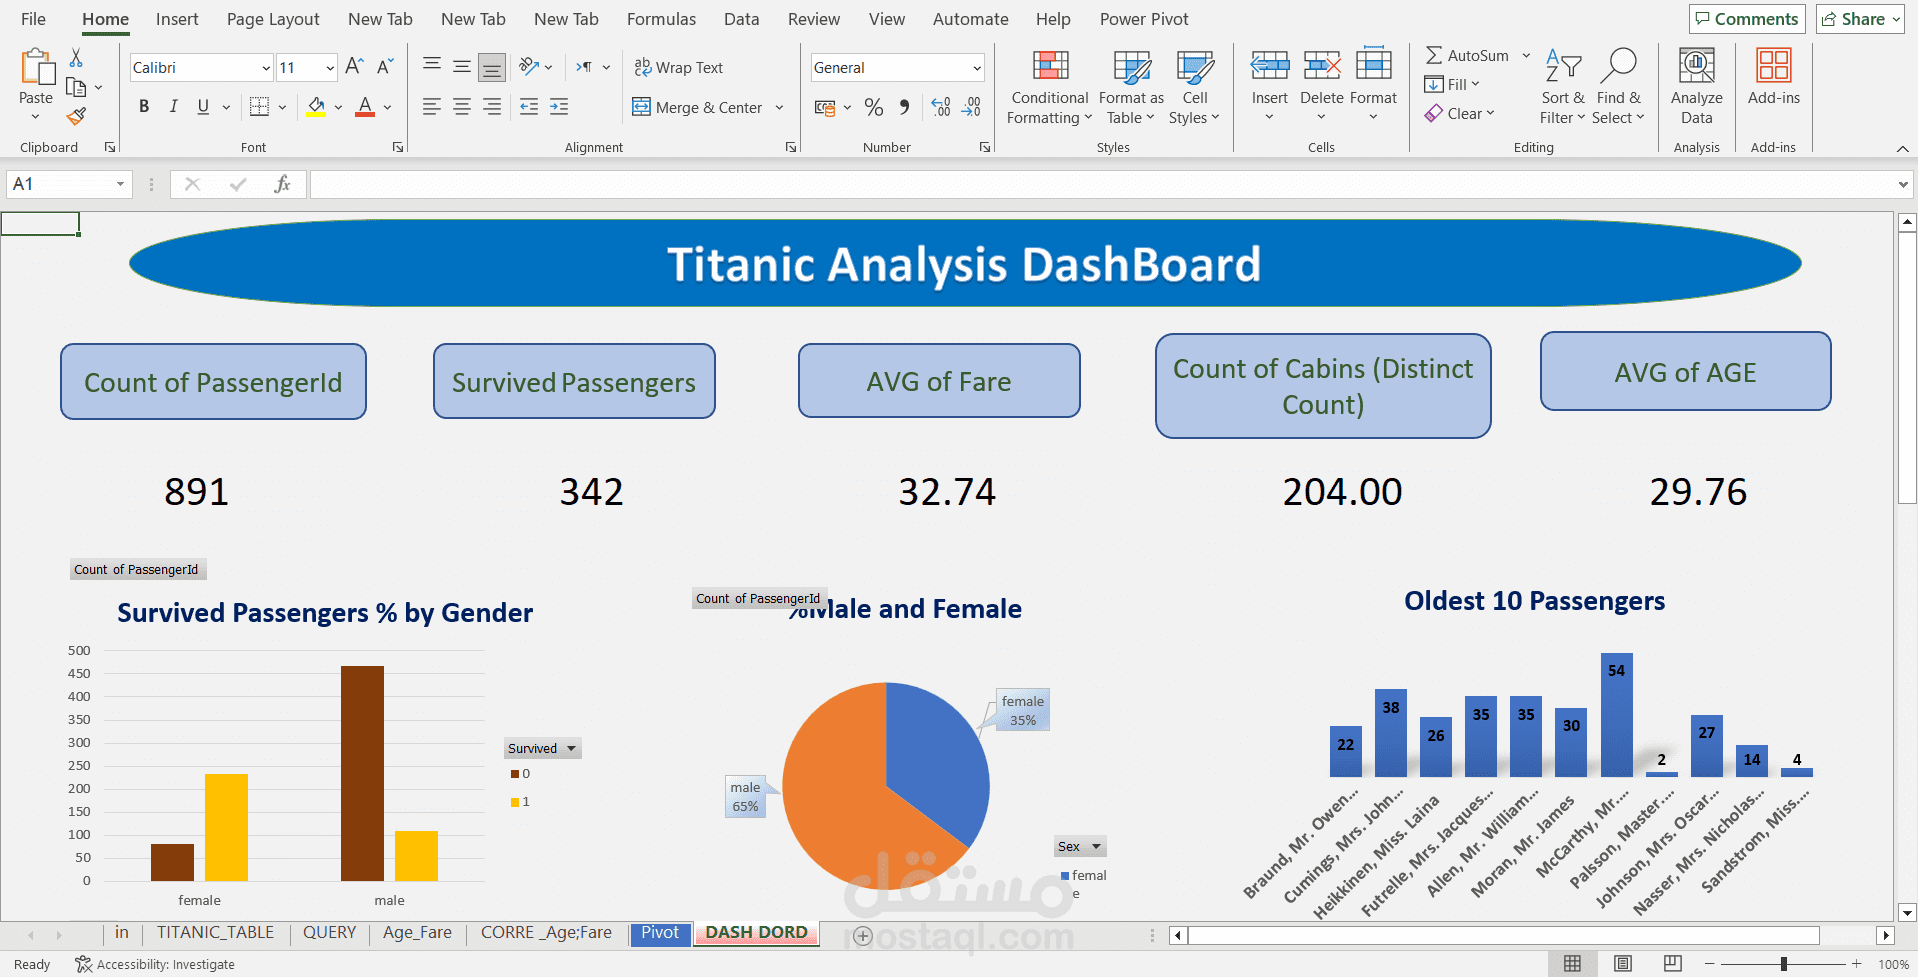
In this project, I created an interactive Excel dashboard to analyze the Titanic dataset. The goal was to provide insights into the survival rates based on factors like passenger class, gender, and age.
Key Features:
Breakdown of survival rates by class, gender, and age group.
Passenger demographics (gender, age, class).
Fare distribution analysis to explore financial diversity.
Interactive charts and PivotTables for easy filtering and data exploration.
