Call center Record Performance
تفاصيل العمل
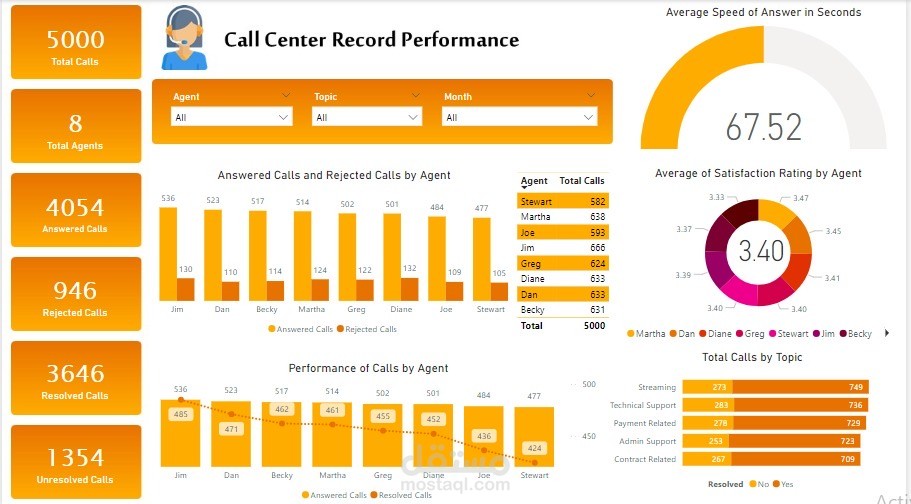
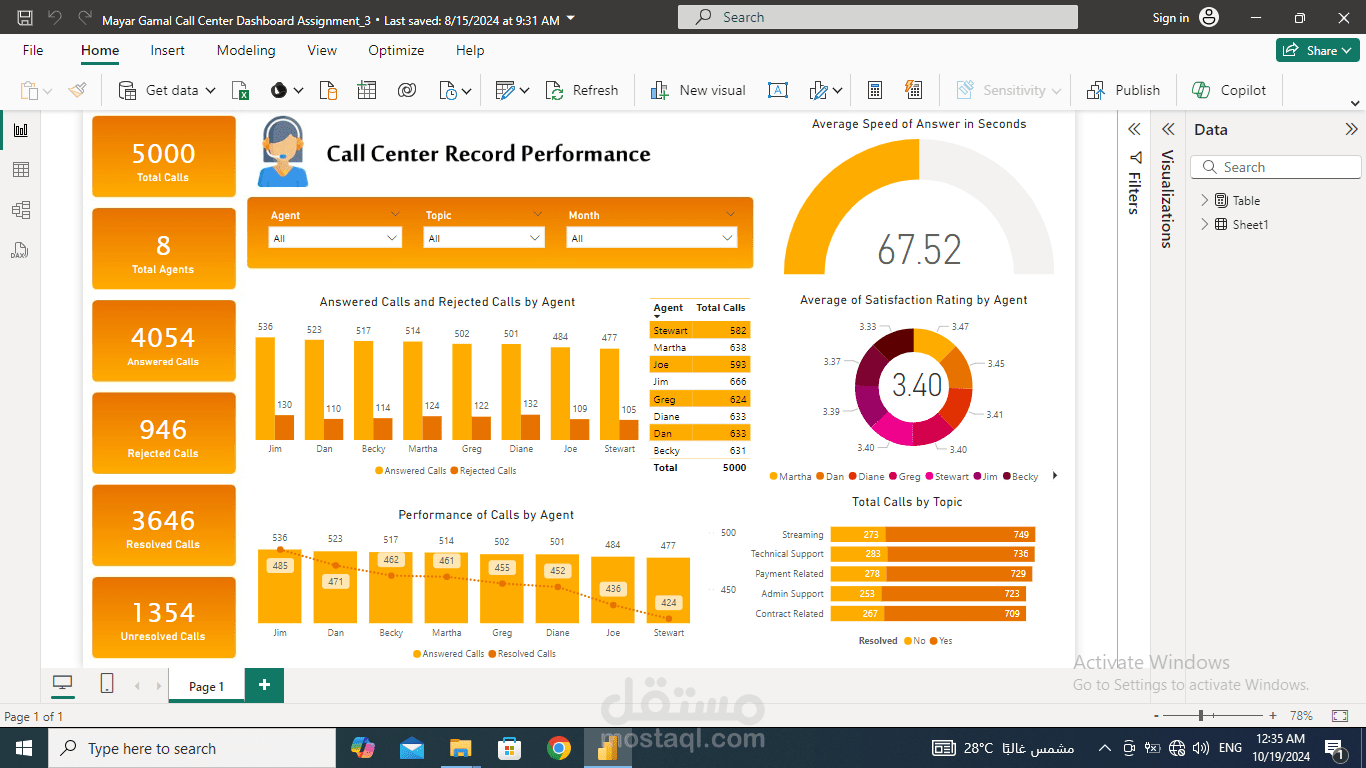
This Power BI Call Center Performance Dashboard provides a comprehensive overview of key metrics related to call center activity, agent performance, and customer satisfaction. The dashboard includes the following sections:
1. Summary of total calls and agents:
- Total calls: 5000
- Total agents: 8
- Answered calls: 4054
- Rejected calls: 946
- Resolved calls: 3646
- Unresolved calls: 1354
2. Answered calls and rejected calls by agent:
- This bar chart shows the breakdown of answered and rejected calls for each agent. Jim handled the most calls with 536 answered and 130 rejected, while Becky had the least with 502 answered and 124 rejected.
3. Performance of calls by agent:
- This area chart tracks how each agent performed in terms of answered, resolved, and rejected calls. For example, Jim answered 485 calls and resolved 431, while Becky answered 436 calls and resolved 404.
4. Average speed of answer:
- A gauge visual highlights the average time it took agents to answer calls, which is 67.52 seconds.
5. Average of satisfaction rating by agent:
- A donut chart shows the average customer satisfaction rating across all agents, with an overall rating of 3.40. The ratings range from 3.33 (Martha) to 3.47 (Stewart).
6. Total calls by topic:
- A bar chart summarizes the number of calls categorized by topics such as streaming (749 calls), technical support (746), payment-related issues (593), and contract-related issues (709). The chart also indicates whether each topic was resolved or not.
This dashboard helps call center managers monitor agent performance, customer satisfaction, and efficiency in answering and resolving calls. The visual breakdown allows for easy identification of areas needing improvement, such as high rejected calls or lower satisfaction ratings for certain agents.