Real Estate Market Trends Indicator
تفاصيل العمل
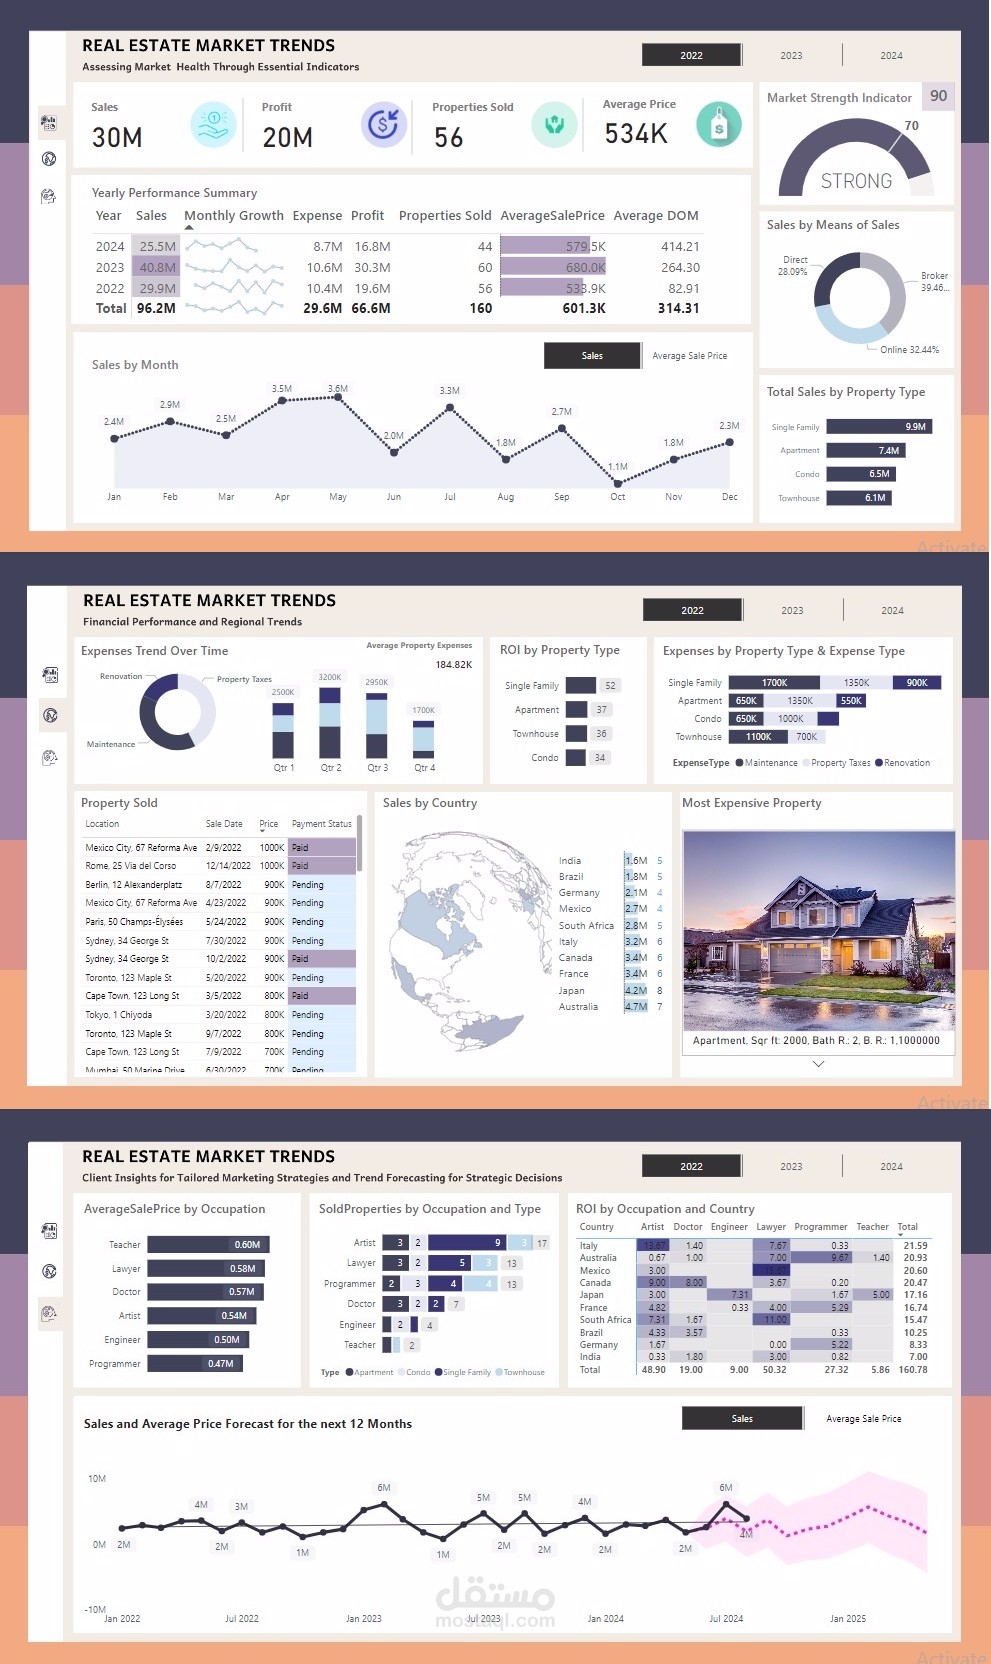
This Power BI dashboard provides a comprehensive analysis of real estate market trends, focusing on key metrics that aid in forecasting and strategic decision-making for stakeholders.
1. Top-Level Market Overview:
- Key Metrics: Sales, Profit, Properties Sold, and Average Price are prominently displayed, providing a snapshot of the overall market performance.
- Market Strength Indicator: A gauge visual representing the current health of the real estate market with a strong value of 90, suggesting favorable conditions.
- Yearly Performance Summary: A detailed breakdown of sales, expenses, profit, properties sold, and average sale prices over multiple years, helping to identify growth trends and areas of opportunity.
- Sales by Month: A line graph visually showing fluctuations in monthly sales, allowing users to track seasonality and identify peak sales periods.
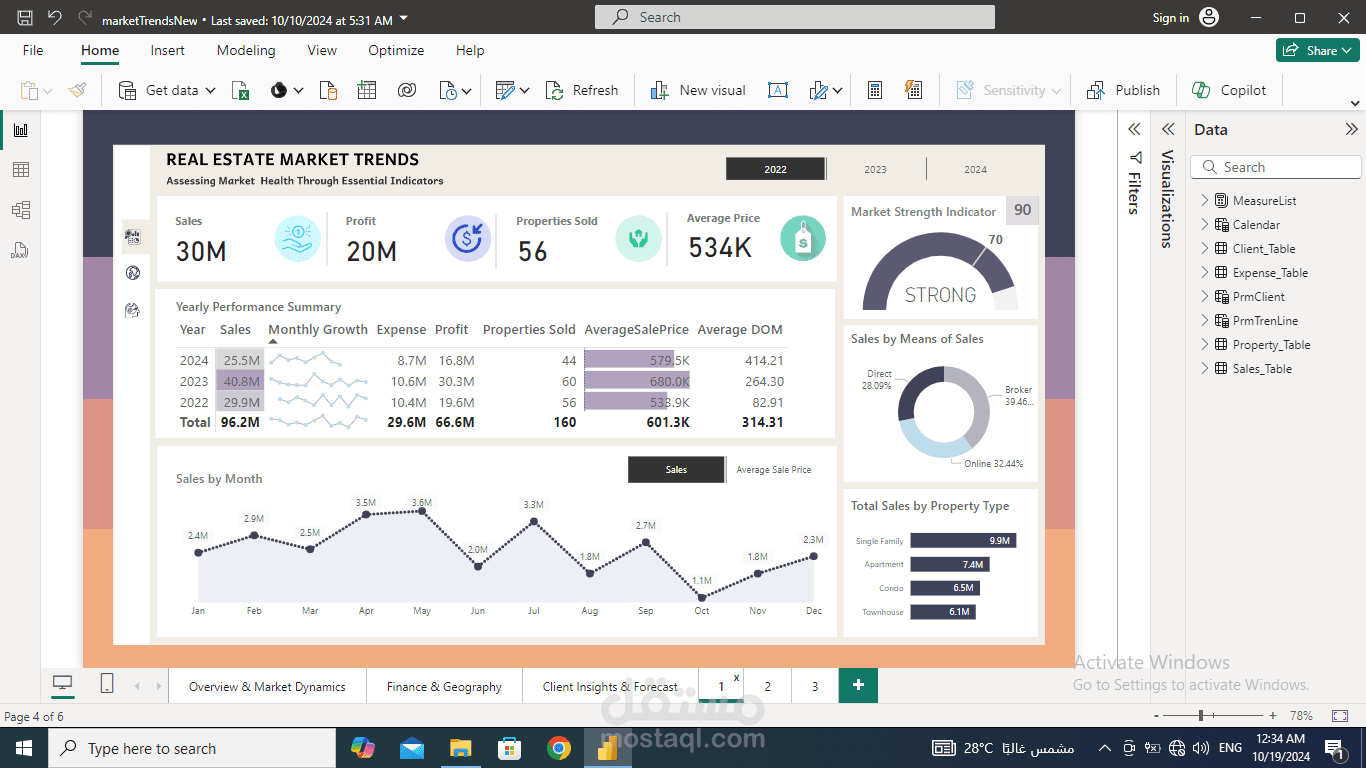
2. Financial and Regional Insights:
- Expenses Trend: A doughnut chart provides insights into property-related expenses such as renovation, maintenance, and property taxes, helping users assess cost distribution.
- ROI by Property Type: A bar chart showcases Return on Investment (ROI) by property type (Single Family, Apartment, Condo, Townhouse), guiding investors on which property types yield the best returns.
- Sales by Country: A map visual displays property sales across different countries, highlighting key international markets like the U.S., Canada, and Germany.
- Property Listings: A table with key details (location, sale date, payment status) of listed properties provides a quick glance at recent transactions and pending sales.
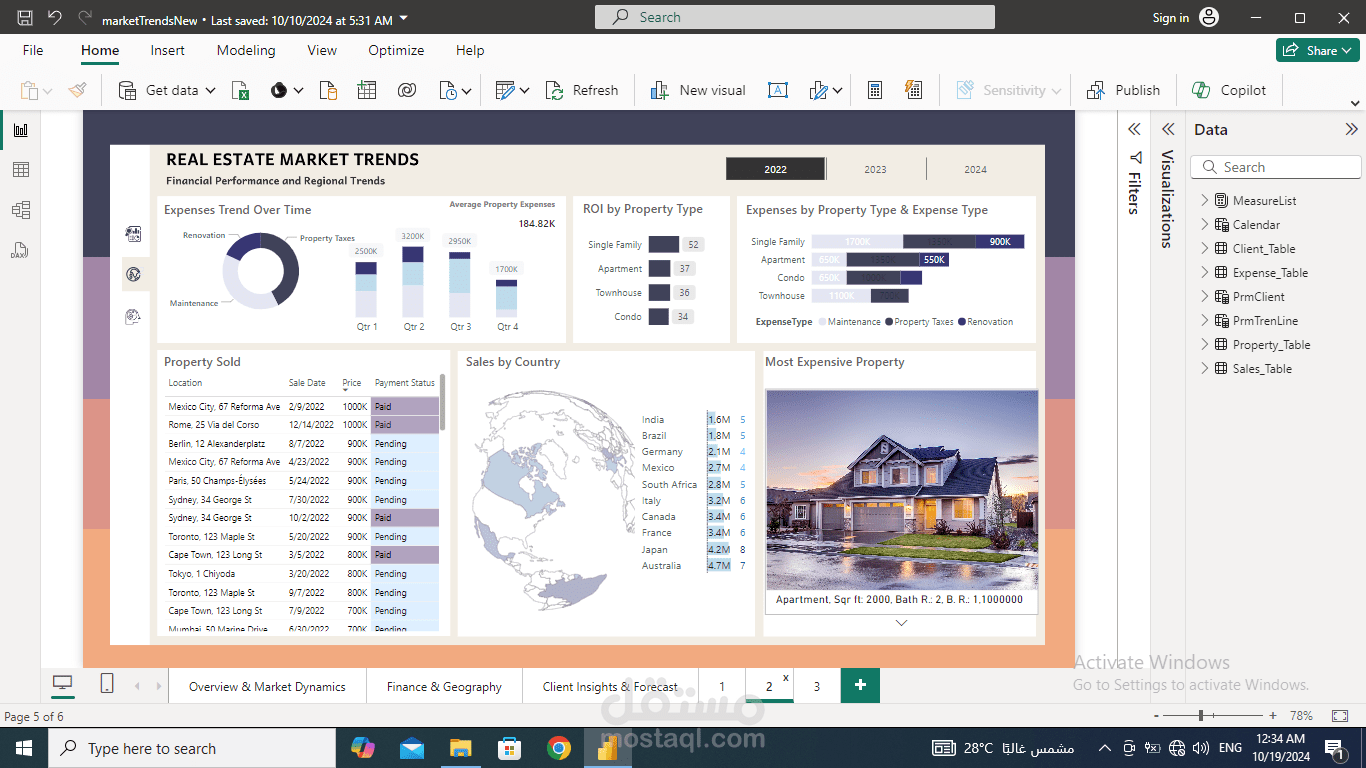
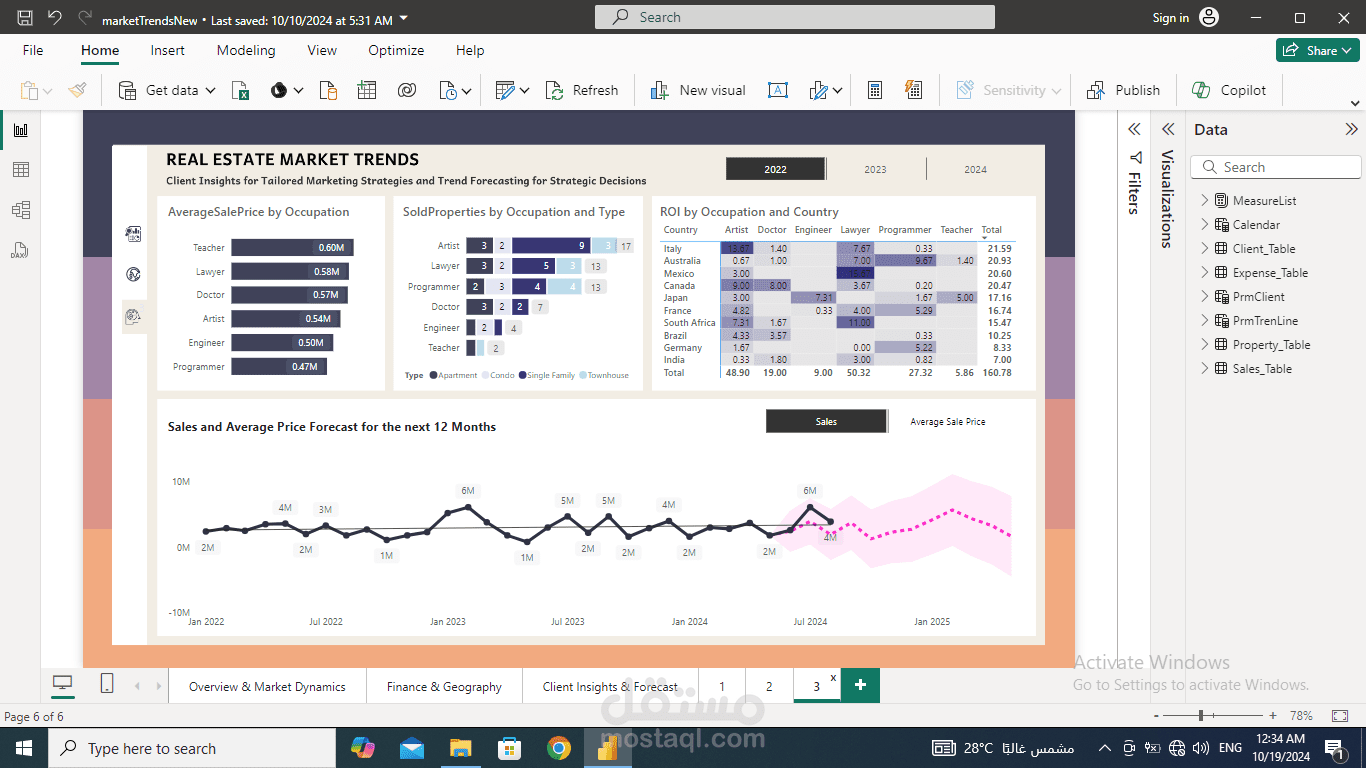
3. Client-Specific Insights:
- Average Sale Price by Occupation: A bar chart analyzing the average sale prices based on the buyer's occupation, helping tailor marketing strategies towards specific professions.
- Sold Properties by Occupation and Property Type: A matrix visual cross-tabulates occupations with the type of properties purchased (Apartment, Condo, Single Family), offering a more targeted understanding of market segments.
- ROI by Occupation and Country: A heat map-style table showing the ROI for different occupations across various countries, aiding in understanding global buyer trends and performance.
4. Predictive Analytics:
- Sales and Average Price Forecast: A line graph predicting sales and average price movements for the next 12 months based on historical data, providing a forward-looking perspective to anticipate market conditions.
This dashboard effectively brings together various insights to assist real estate professionals, investors, and stakeholders in tracking market performance, managing expenses, and making data-driven decisions for future investments.