Adventure works analysis
تفاصيل العمل
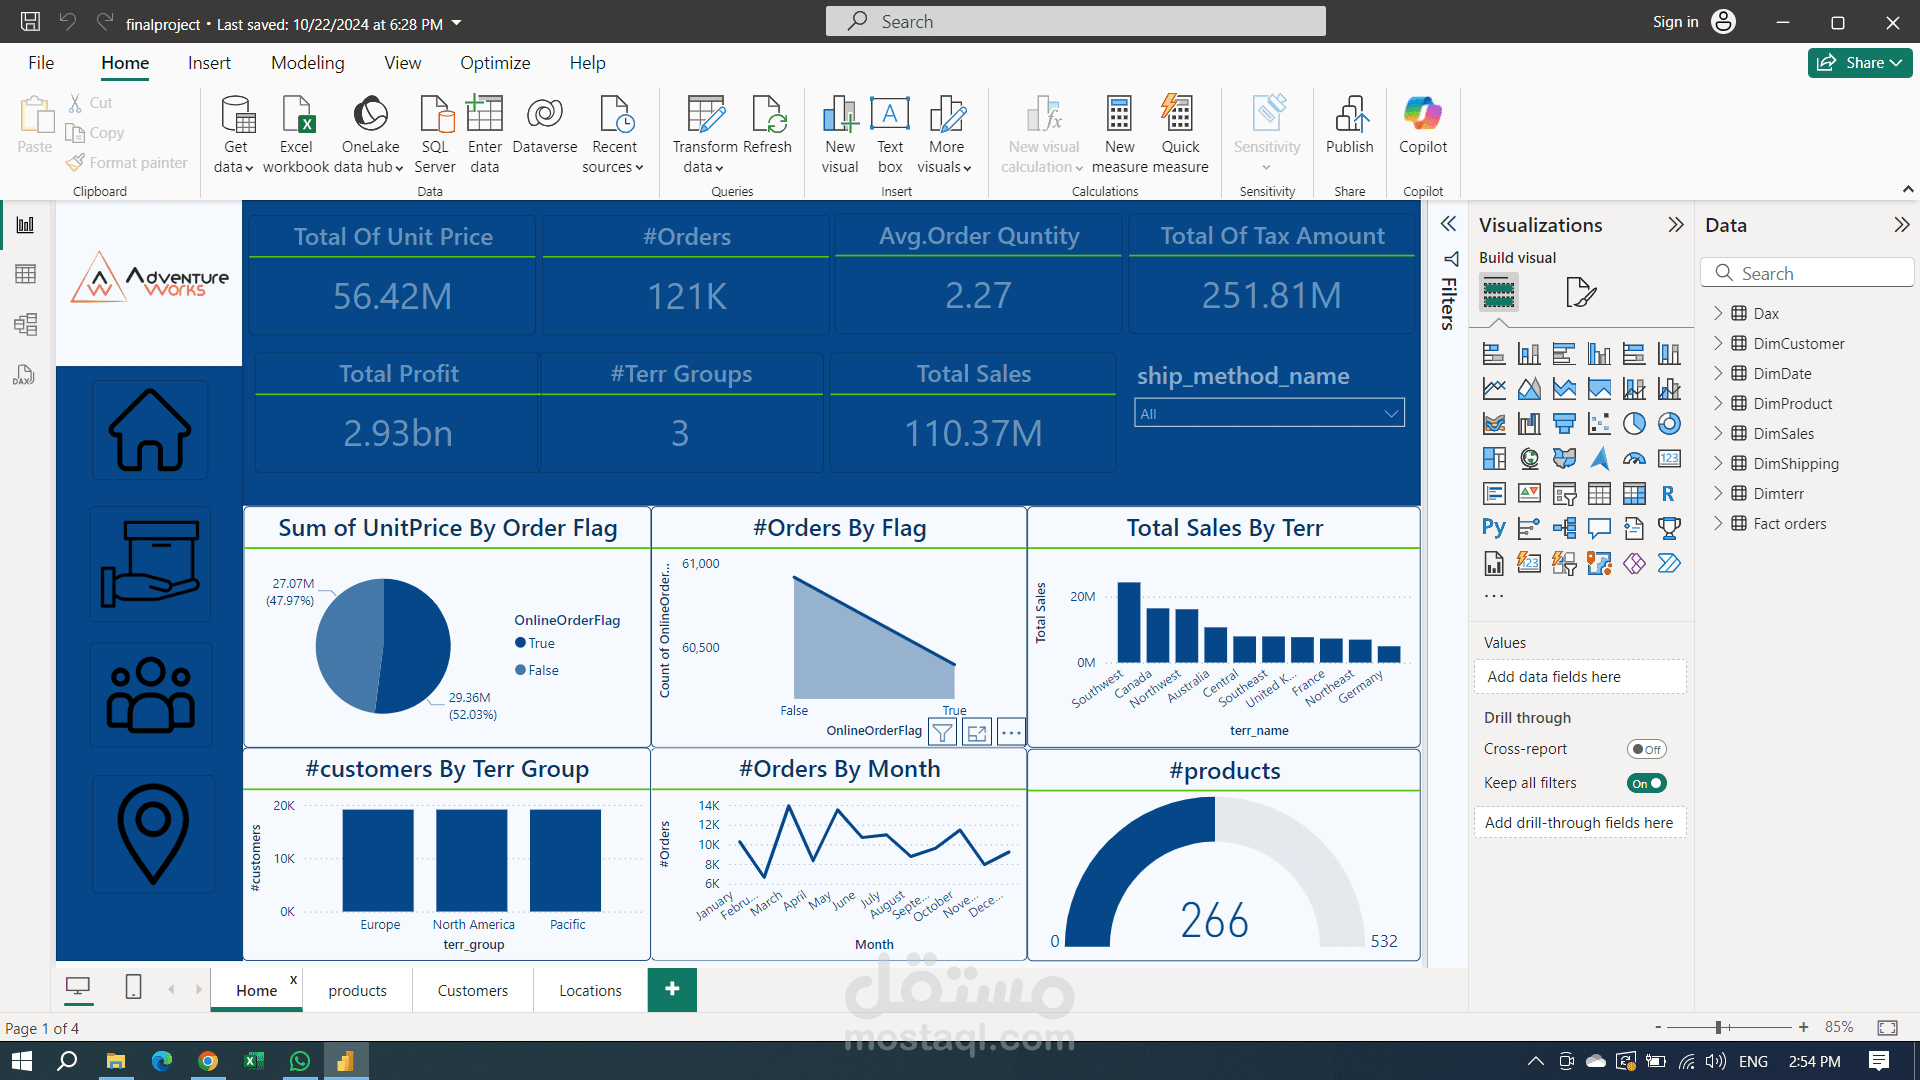
In this project, I performed an end-to-end data analysis process for Adventure Works using Power BI. The steps involved included:
Data Cleaning with Power Query: I began by importing and transforming raw data from the Adventure Works database using Power Query. This involved removing duplicates, handling missing values, and ensuring data consistency for accurate analysis.
Data Modeling: After cleaning the data, I created a robust data model, establishing relationships between tables to ensure seamless integration and efficient querying. This step enabled me to build meaningful insights from the data.
DAX Measures: I implemented advanced DAX (Data Analysis Expressions) measures to calculate key metrics, such as sales performance, product trends, and customer behavior. These measures allowed for dynamic analysis and reporting.
Power BI Dashboards: I designed and created four interactive dashboards to visualize the insights:
Home Dashboard: Overview of key metrics and KPIs.
Products Dashboard: Insights into product performance, including sales trends and inventory levels.
Customers Dashboard: Analysis of customer segments, buying patterns, and demographics.
Locations Dashboard: Insights into sales by geographical location and regional trends.
The final deliverables provided a comprehensive and dynamic view of the business performance, enabling decision-makers to quickly identify trends, track progress, and make informed decisions.