Data Analysis Project for a Supermarket Using Excel
تفاصيل العمل
In this project, I collected, cleaned, and analyzed sales data for a supermarket using Excel. The project includes:
Data Cleaning: Removing missing values and correcting errors in the data to ensure accurate analysis.
Table Relationships: Creating relationships between different tables to facilitate information extraction.
Using Formulas: Applying Excel formulas to analyze data and extract important results.
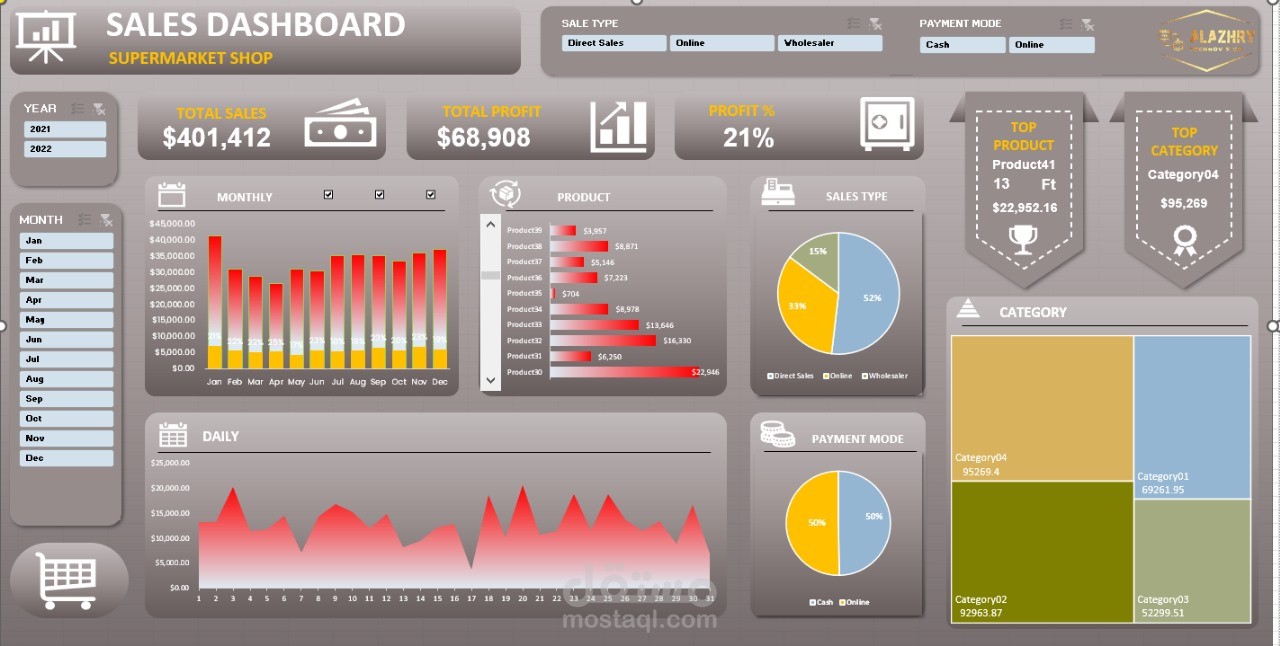
Dashboard Design: Designing an interactive dashboard using Excel tools like pivot tables and charts to visualize data clearly and easily.
Key Results:
Total Sales:
Total Profit:
Profit Percentage:
Visualizations:
Monthly Sales: A bar chart showing sales for each month.
Category Distribution: A pie chart showing sales distribution by category.
Payment Methods: A pie chart showing sales distribution by payment methods.
Daily Sales: A line chart showing daily sales fluctuations.
Expectations:
Increase in Sales: Sales are expected to increase by 10% in the coming months based on seasonal patterns.
Improved Profitability: Profit percentage can be improved to 25% by focusing on the most profitable categories.
Enhanced Payment Strategies: By understanding customer preferences in payment methods, customer experience can be improved and sales can be increased.
