Titanic Dataset Cleaning and Analysis
تفاصيل العمل
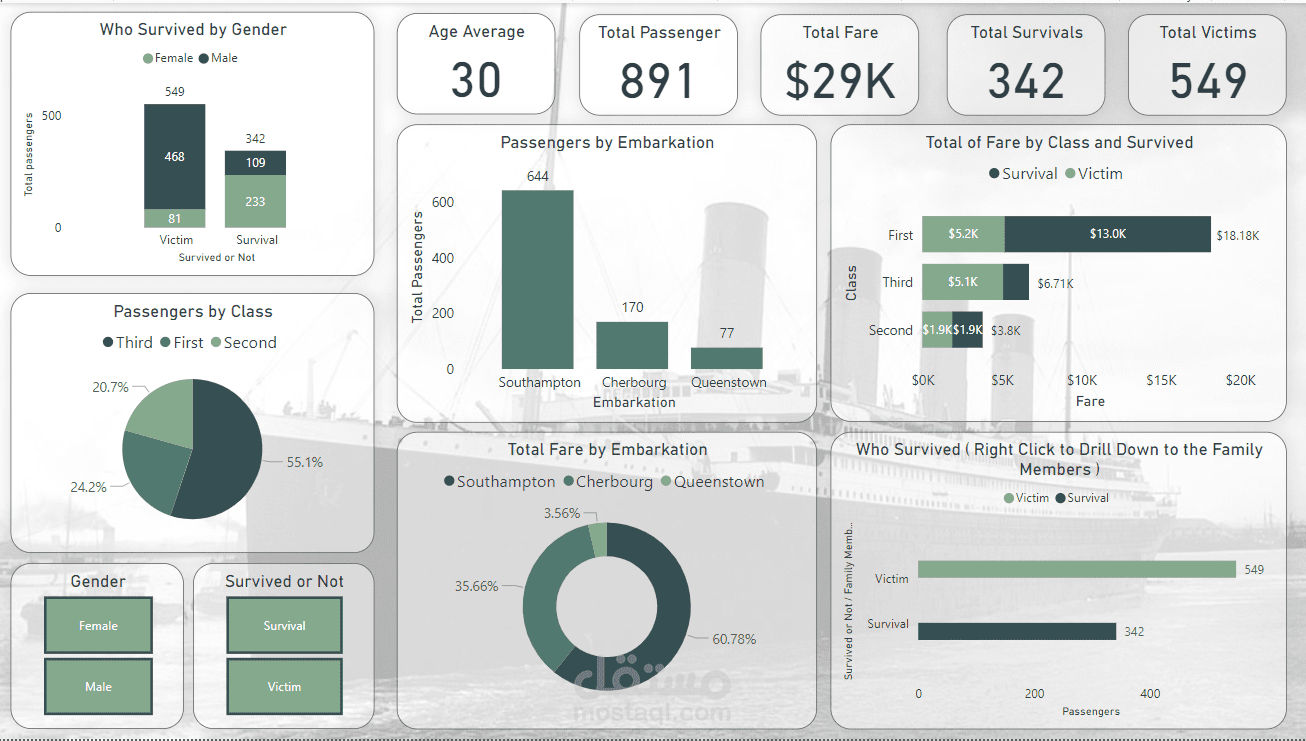
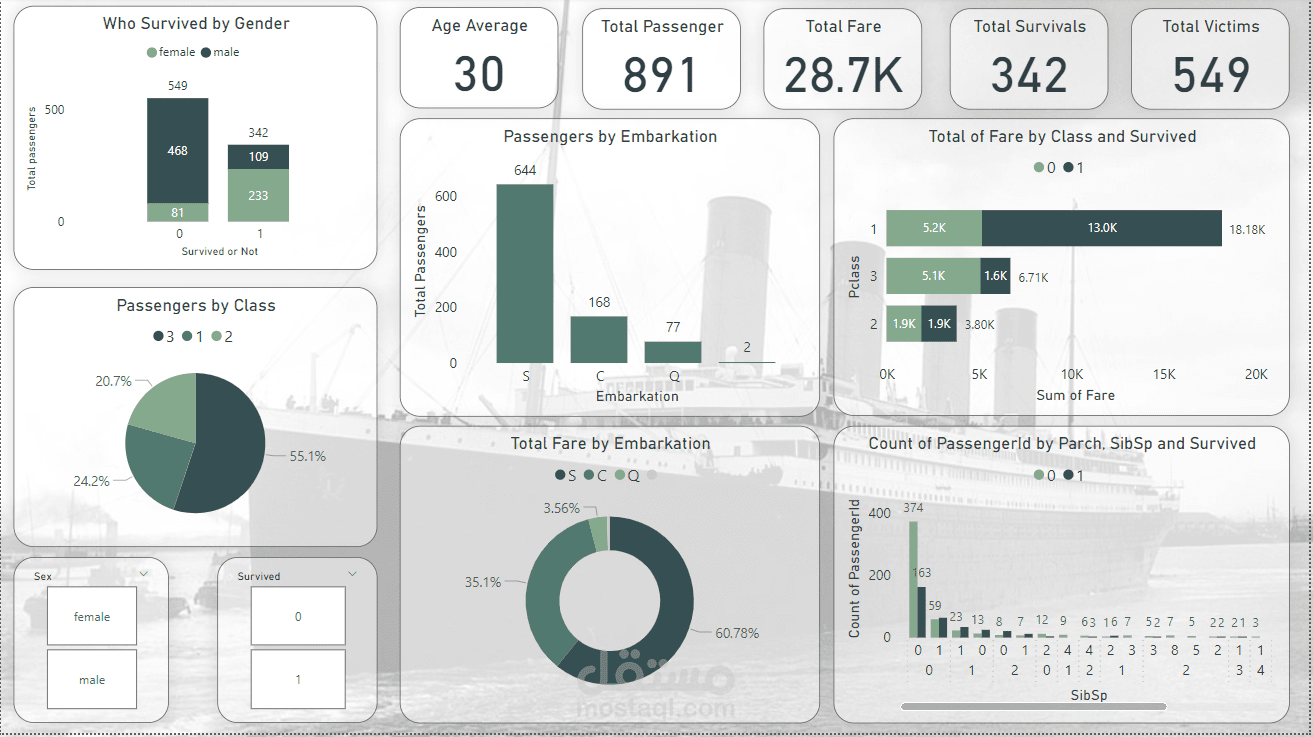
I created two dashboards analyzing the Titanic dataset—one with uncleaned data and another with cleaned data. In the uncleaned version, issues like missing values, outliers, and inconsistent categories made the visualizations unclear and unreliable. The raw data resulted in skewed analyses, cluttered visuals, and inaccurate groupings, which masked meaningful insights.
In contrast, the cleaned dashboard presented clear, accurate trends by handling missing data, adjusting outliers, and standardizing categories. This led to focused visuals that offered actionable insights, such as survival rates by age, gender, and class, demonstrating the critical role of data cleaning in effective analysis.