Uber 2016 data analysis
تفاصيل العمل
Summary:
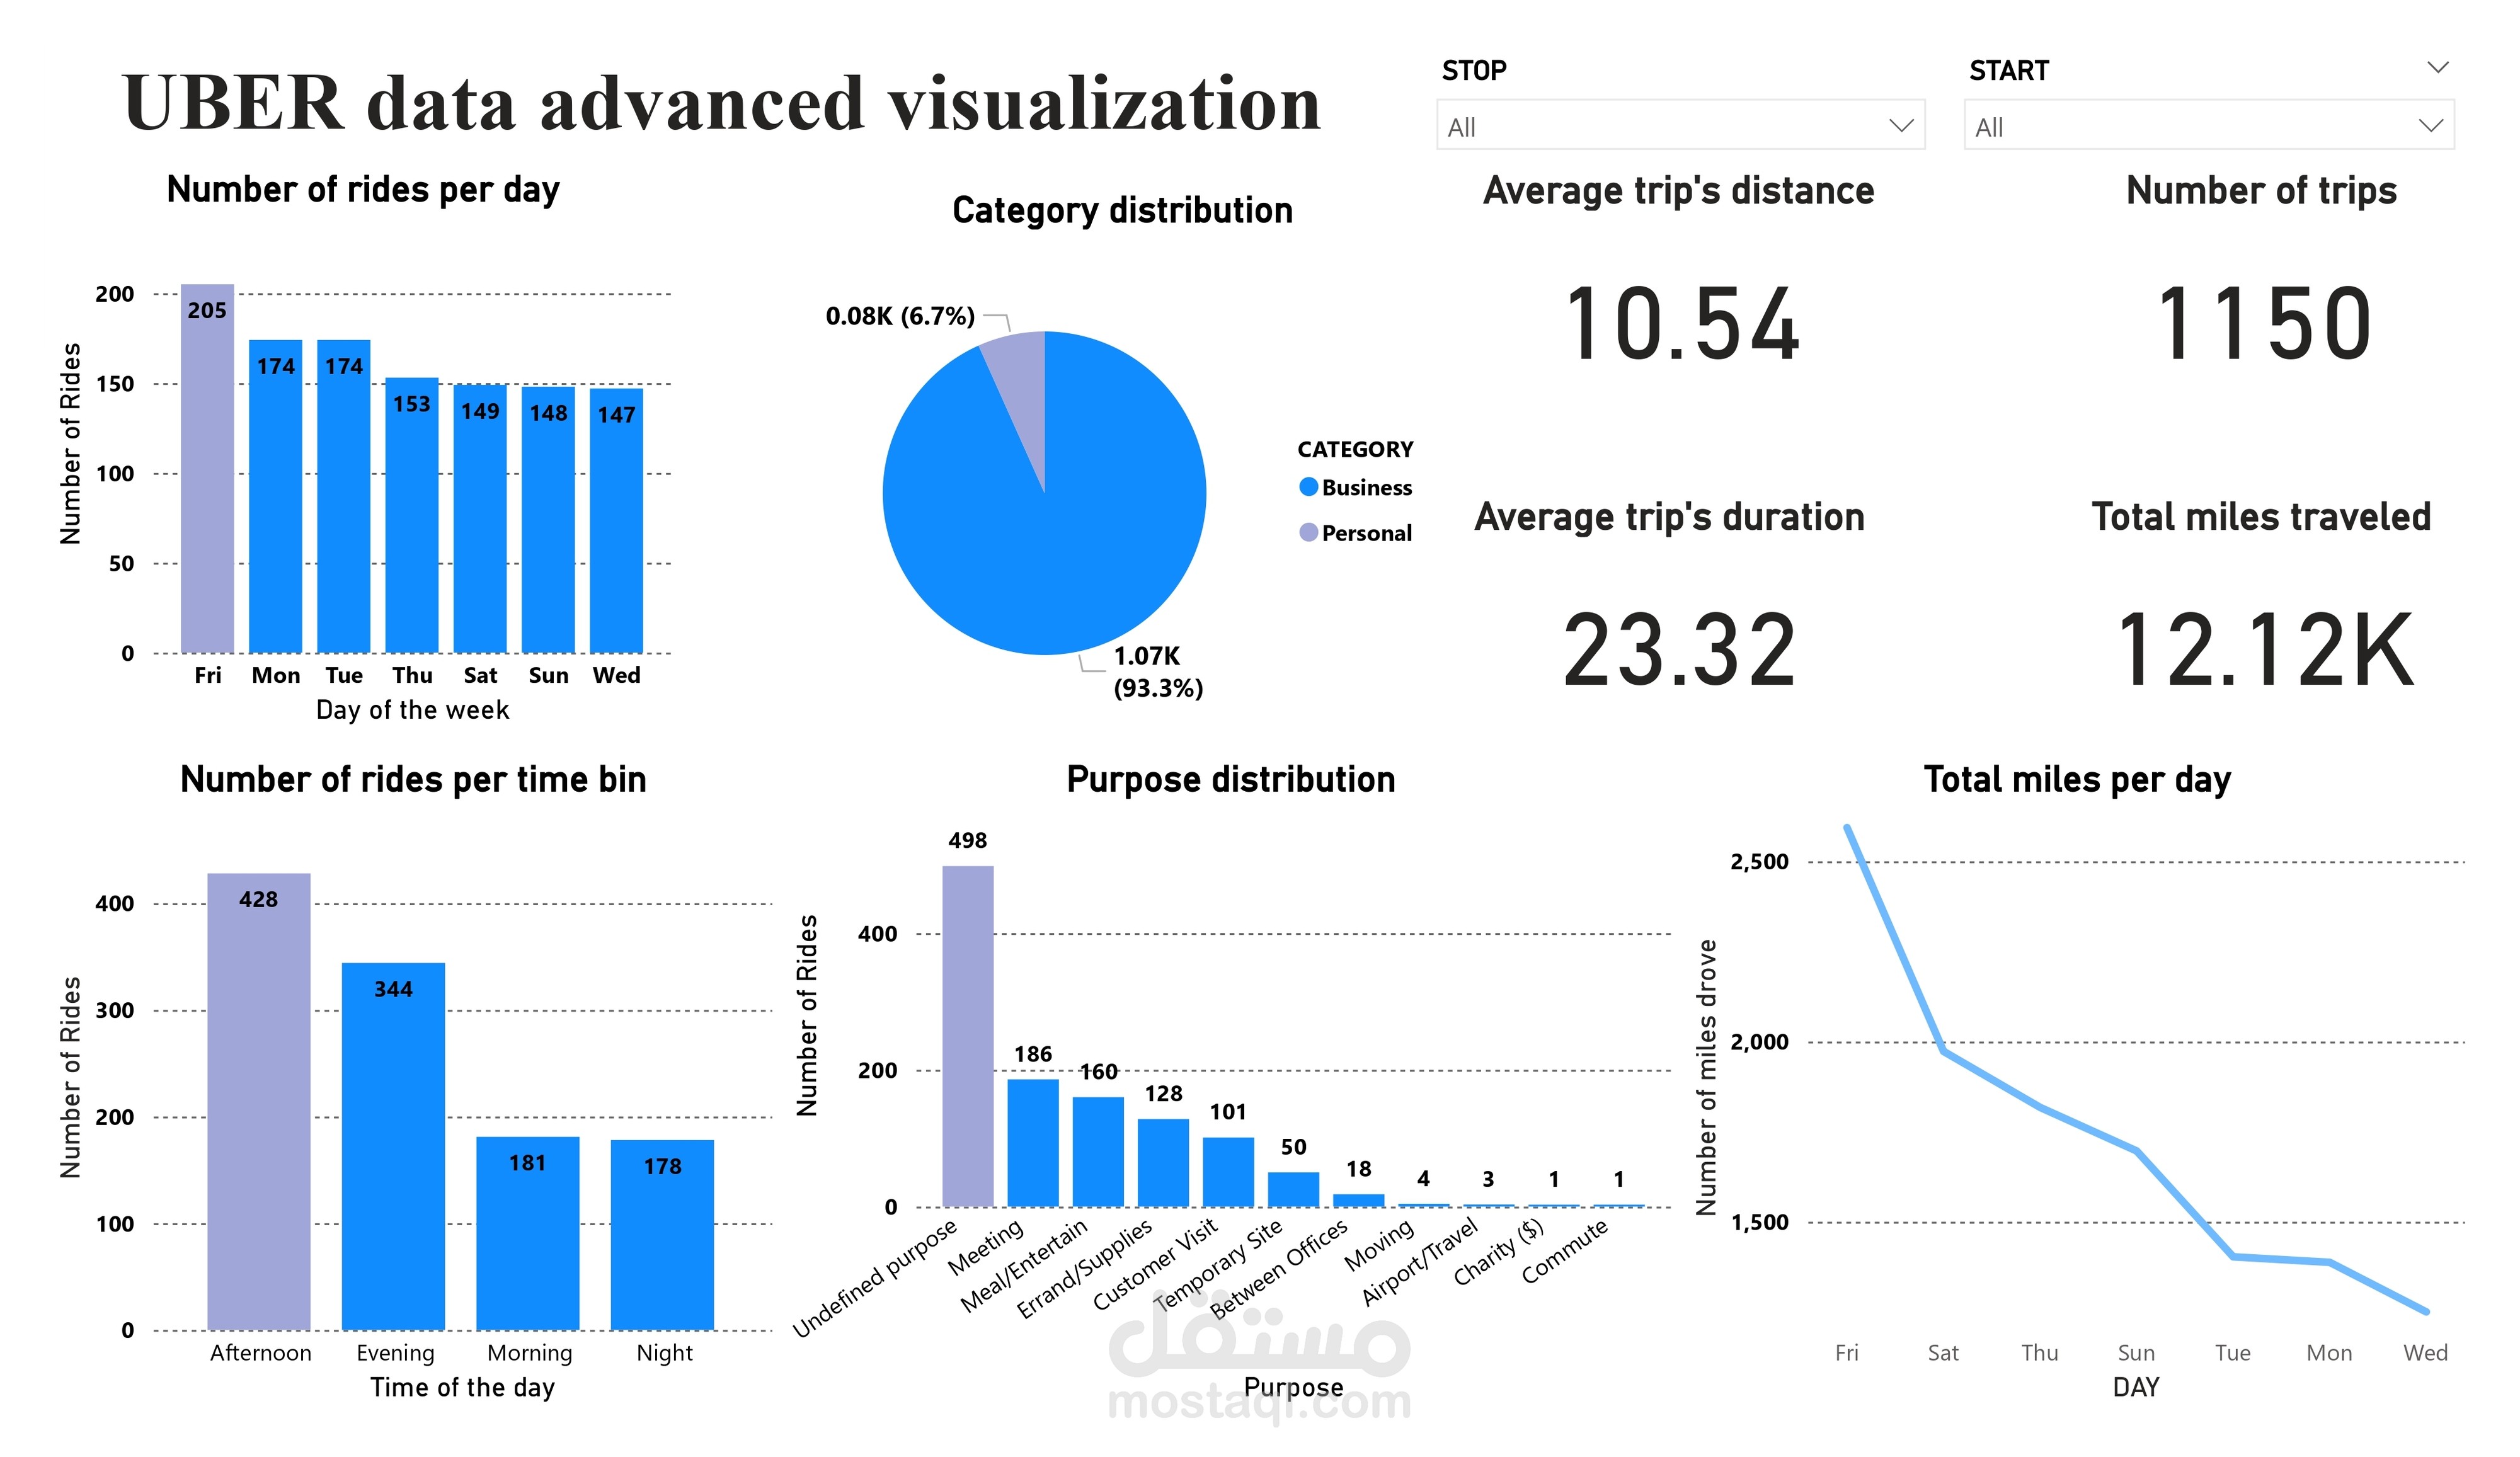
This project involves analyzing Uber's 2016 ride data, focusing on key patterns and insights from the dataset. Python was used for data cleaning and processing, while Power BI was employed to create interactive visualizations that highlight trends and metrics relevant to Uber's operations.
Objectives:
Analyze ride patterns, peak hours, and geographical distribution of Uber rides in 2016.
Identify key factors influencing ride volume and customer behavior.
Use visualization to make the insights more accessible and actionable.
Tools Used:
Python: For cleaning and processing the dataset to ensure it was ready for analysis.
Power BI: To build interactive dashboards and charts that visualize Uber's ride data effectively.
Key Insights:
Peak ride hours, trends across different days of the week, and geographical hotspots were identified.
Data visualizations provided a clear overview of Uber's ride distribution, helping to pinpoint areas of high demand.