Road Accident Analysis with Power BI
تفاصيل العمل
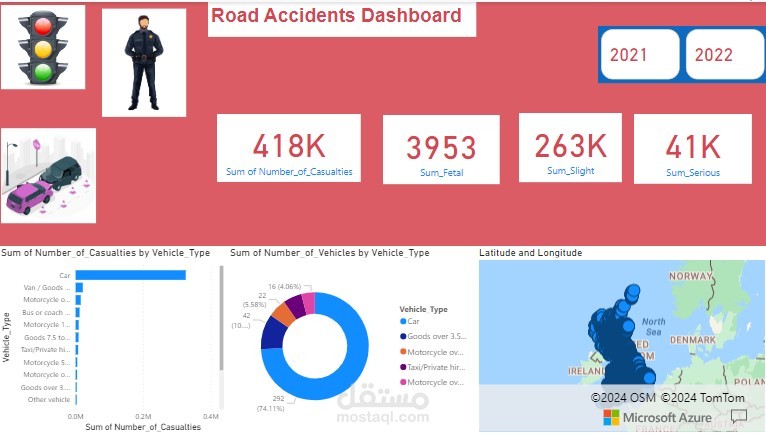
This Power BI report focuses on visualizing road accident data to analyze trends, identify patterns, and enhance road safety measures. The dashboard aims to provide law enforcement agencies, city planners, and safety organizations with actionable insights into road accidents, enabling them to develop targeted strategies for accident prevention and safety improvements.
Objective:
The primary goal of this dashboard is to analyze various aspects of road accidents, such as locations, causes, severity, and demographic factors, to improve public safety and inform policy decisions.
Key Metrics:
Total Accidents: The overall number of road accidents within a specified period (daily, monthly, annually).
Accident Severity: Breakdown of accidents by severity (minor, serious, fatal) to understand the impact of each incident.
Accident Causes: Categorization of accidents by common causes (e.g., speeding, distracted driving, weather conditions).
Accident Hotspots: Identification of locations with the highest incidence of accidents, providing insights into dangerous intersections or road segments.
Time of Day Analysis: Analysis of accidents based on the time of day to identify peak hours for incidents.
Data Visualizations:
Line Charts: Displaying trends in road accidents over time, highlighting increases or decreases in incidents.
Bar Charts: Comparing the number of accidents by severity and cause, allowing for targeted intervention strategies.
Maps: Visualizing accident hotspots on geographic maps, pinpointing areas that require enhanced safety measures or infrastructure improvements.
Heatmaps: Showing time-based trends for accidents to identify the most dangerous hours or days of the week.
KPI Tiles: Highlighting key metrics such as total accidents, percentage of fatal accidents, and average response time to incidents.
Actionable Insights:
Targeted Safety Campaigns: Using data on accident causes and hotspots to develop focused road safety campaigns in high-risk areas.
Infrastructure Improvements: Informing local governments about necessary changes in road design, signage, and traffic signals based on accident trends.
Enhanced Law Enforcement: Identifying times and locations for increased traffic enforcement to deter unsafe driving behaviors.
This Road Accident Analysis Dashboard provides stakeholders with the insights necessary to enhance road safety, reduce accidents, and promote informed decision-making for improved public safety initiatives.