Global-Terrorism-EDA
تفاصيل العمل
Global-Terrorism-EDA
Objective: The goal of this project is to make EDA and finding the insights derived from the data
This project is part of the ITI data engineering track python course,
the goal is to use as much data analaytics tools in python such as matplotlib, pandas, dask, plotly, seaporn.
Methodology
1st. Preprocessing
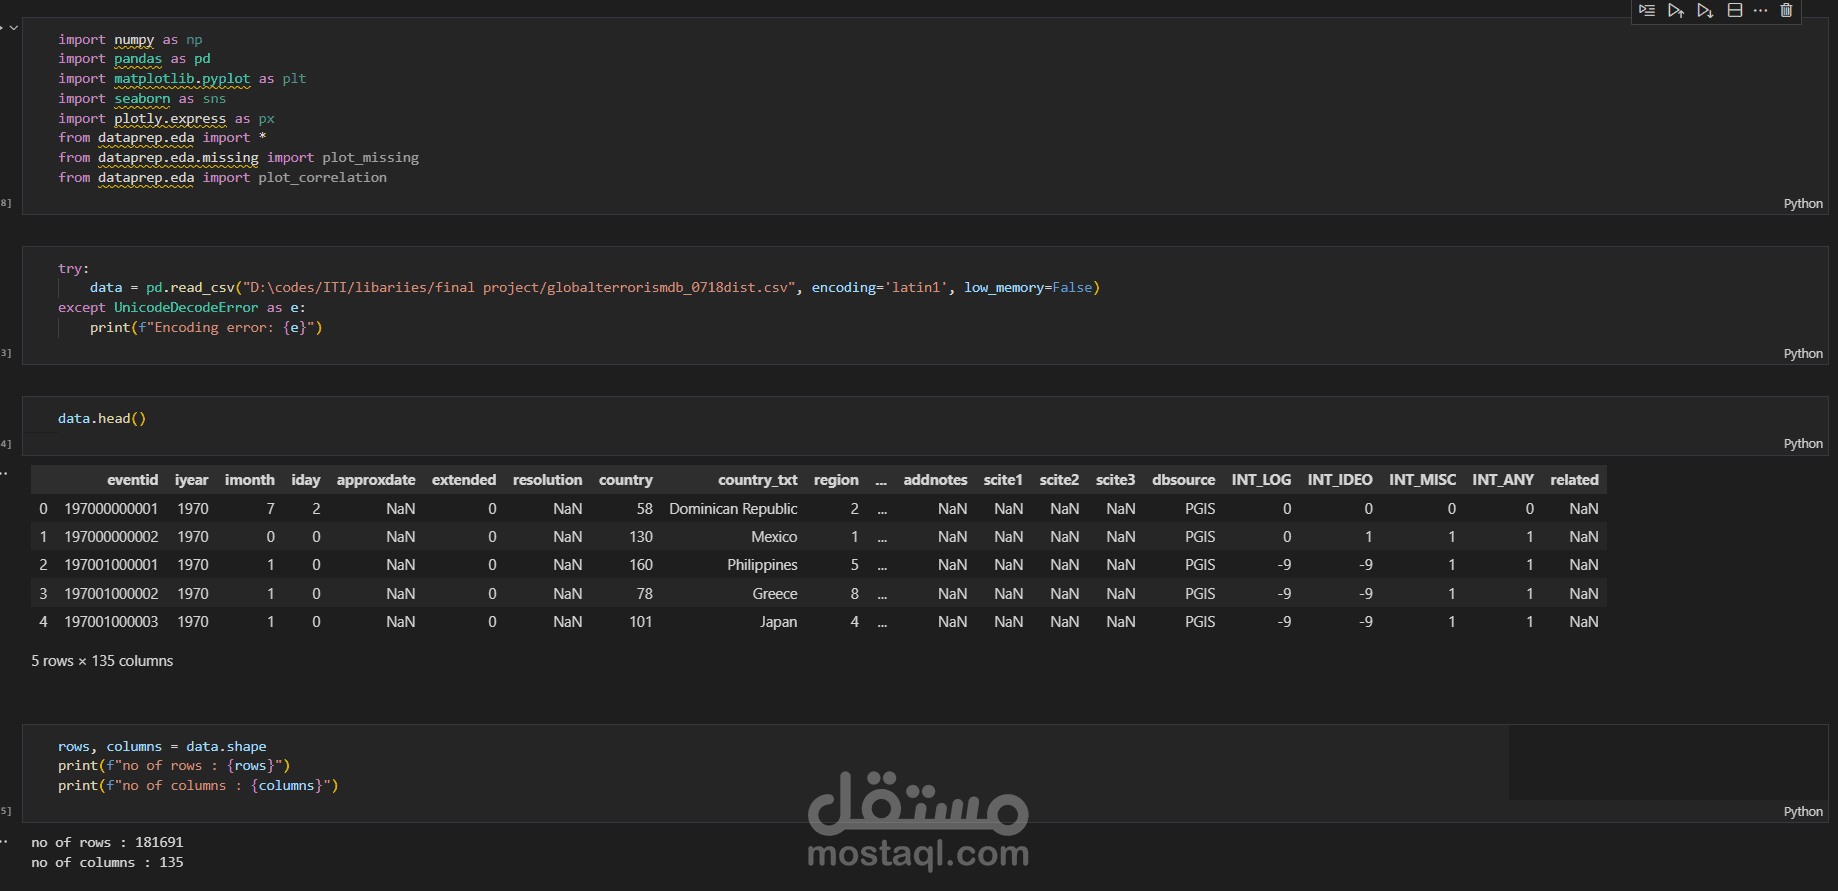
1- Reading data
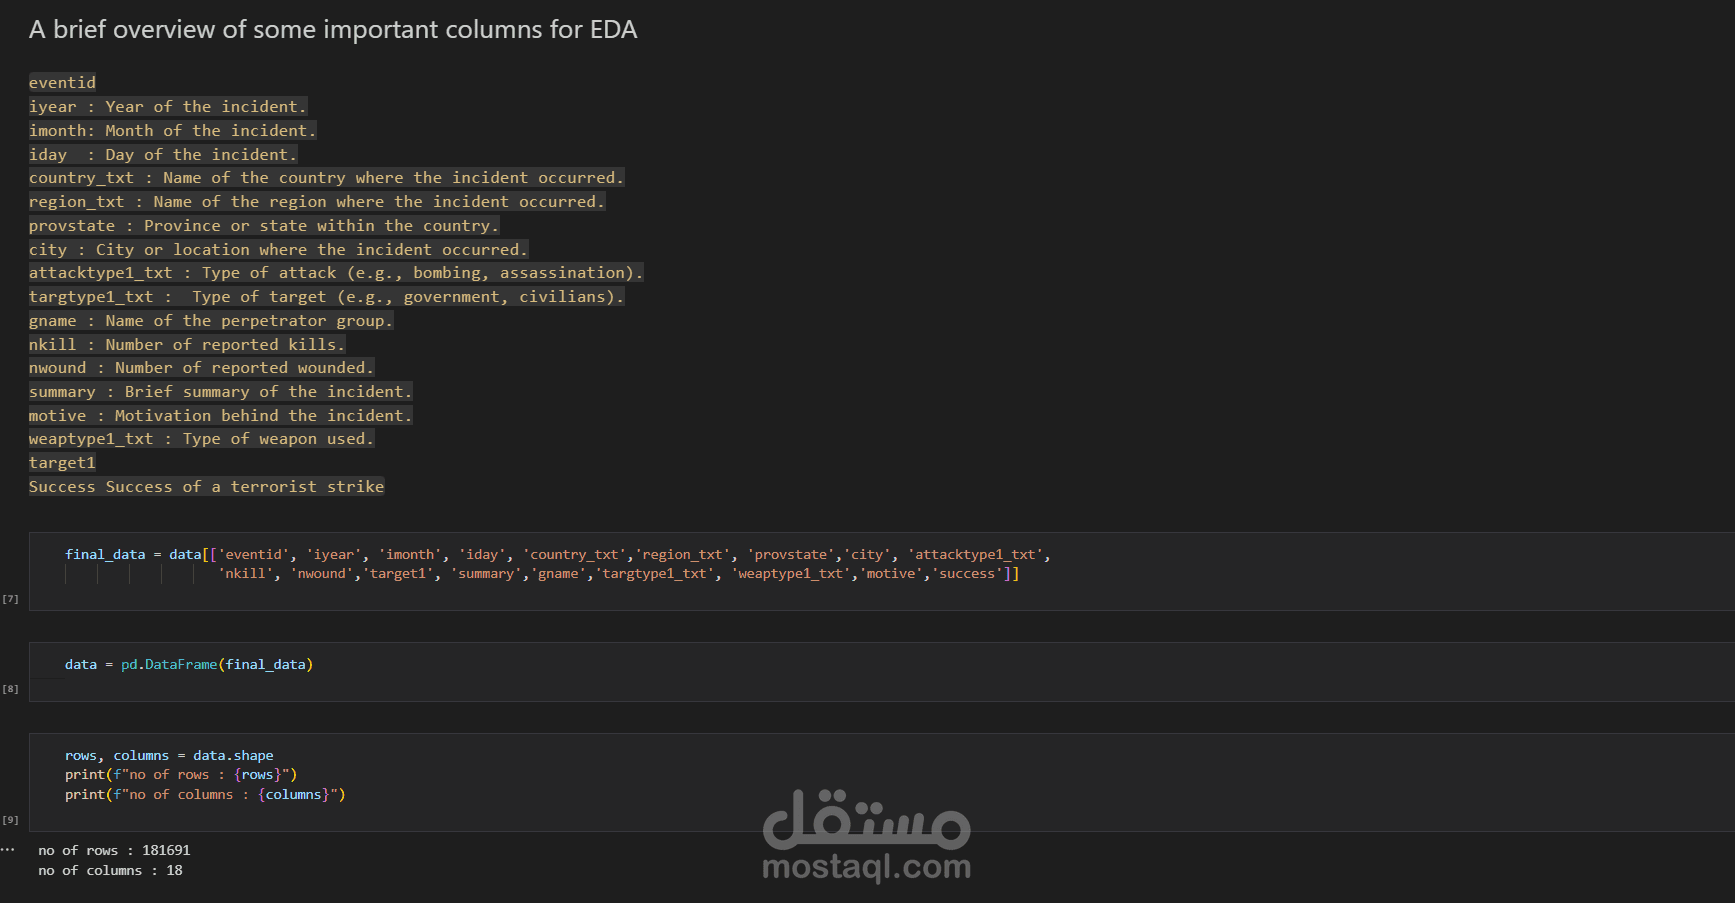
2- Feature selection
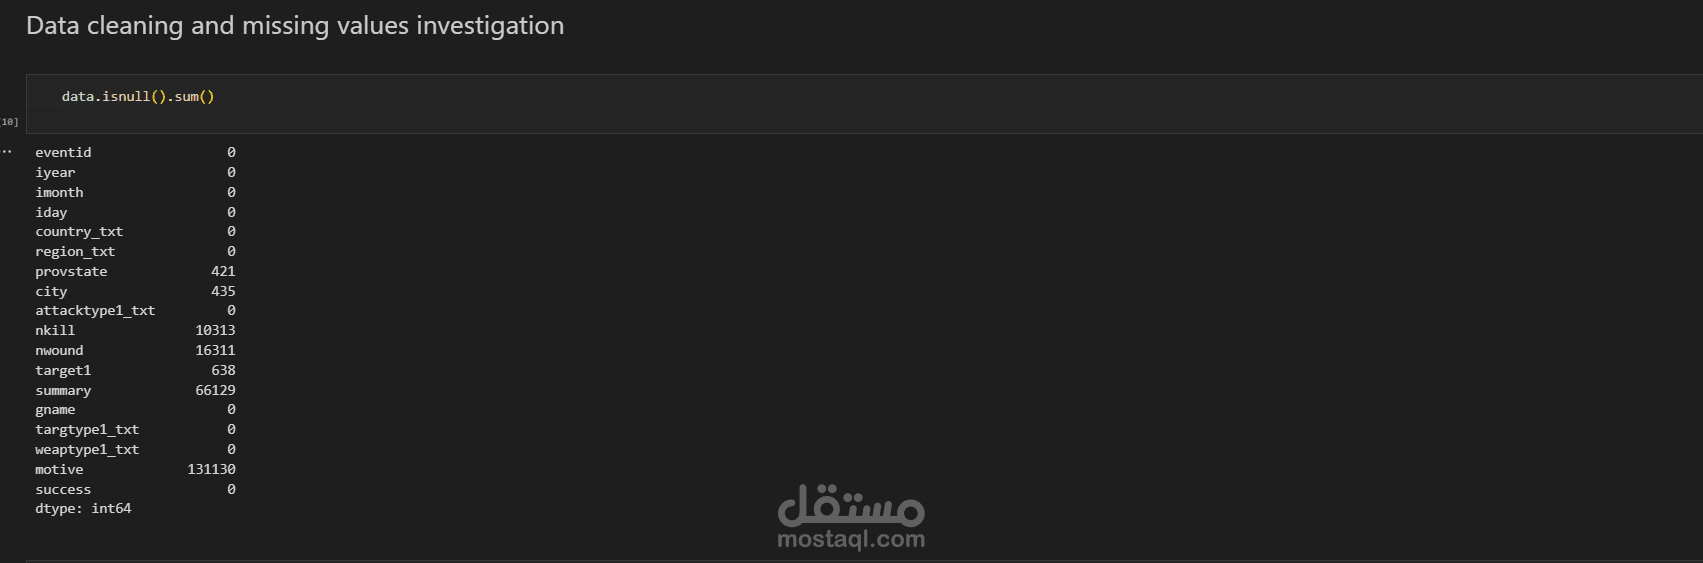
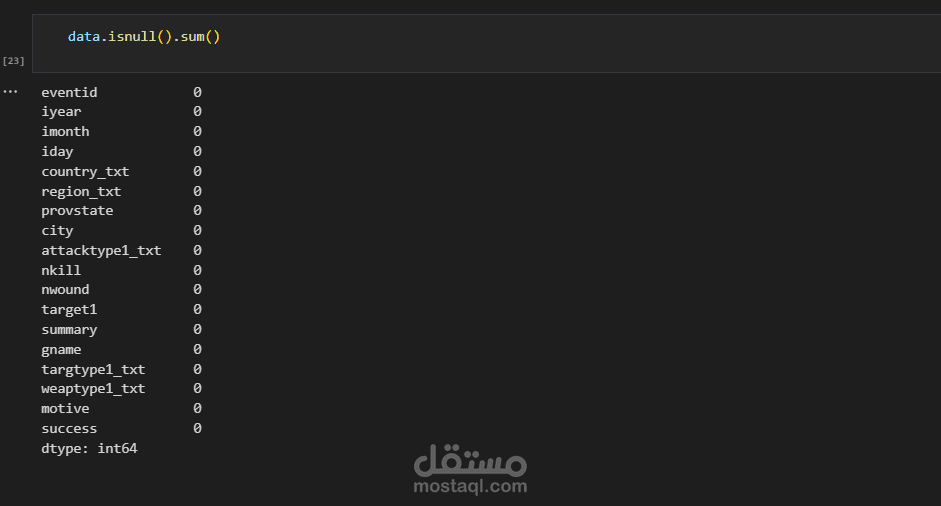
3- Data quality & missing values investigation
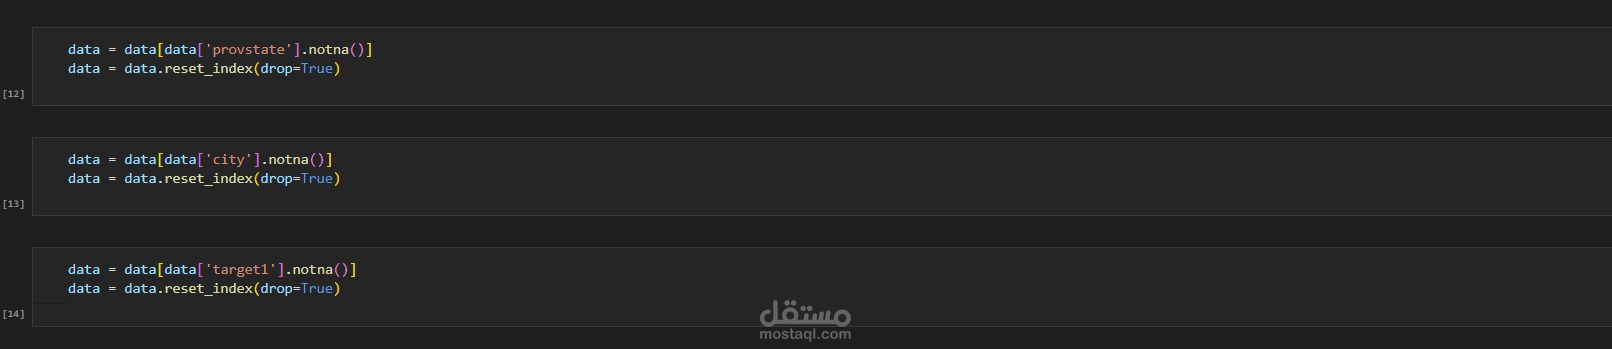
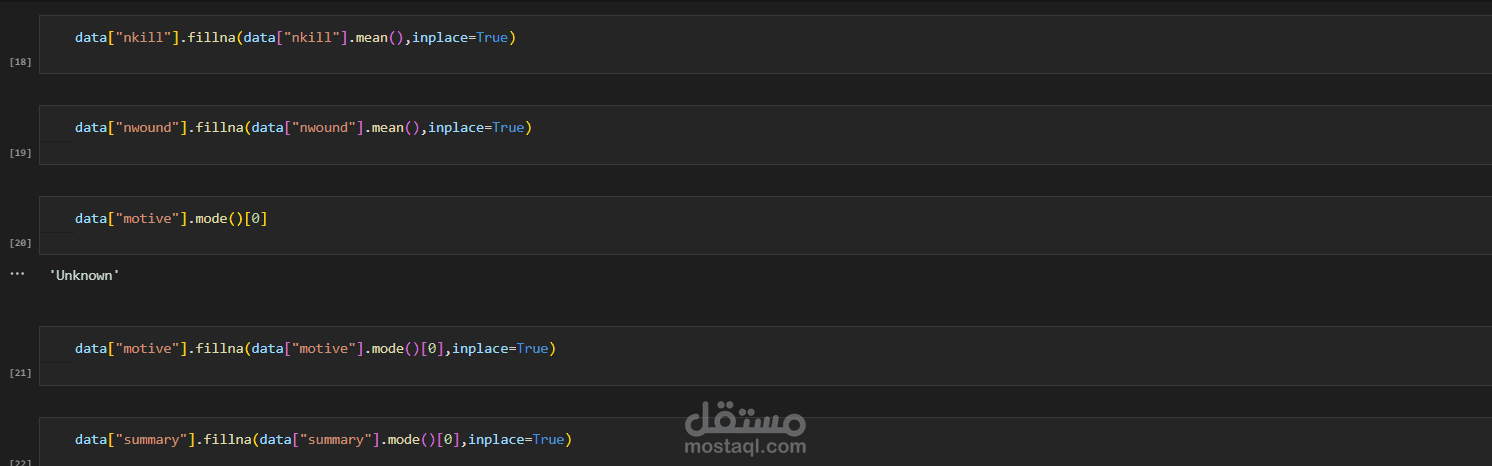
4- Handle missing values
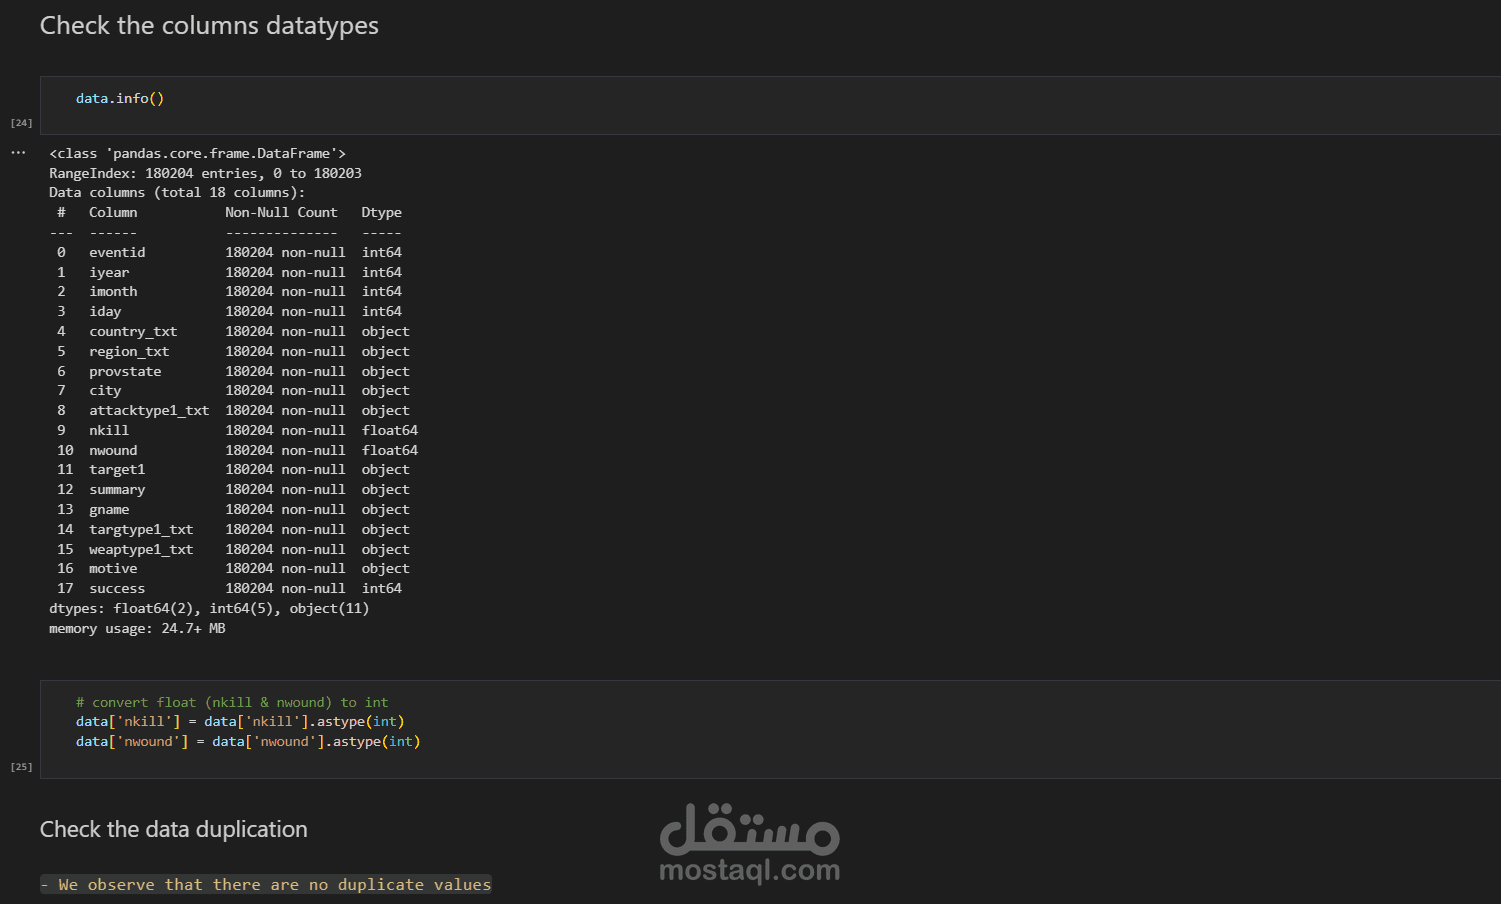
5- Check the columns datatypes
6- check the data duplication
7- Store the cleaned dataset as (‘data.csv’)
2nd. Data Analysis
1- Calculate the mean, median, and standard deviation of relevant numeric columns
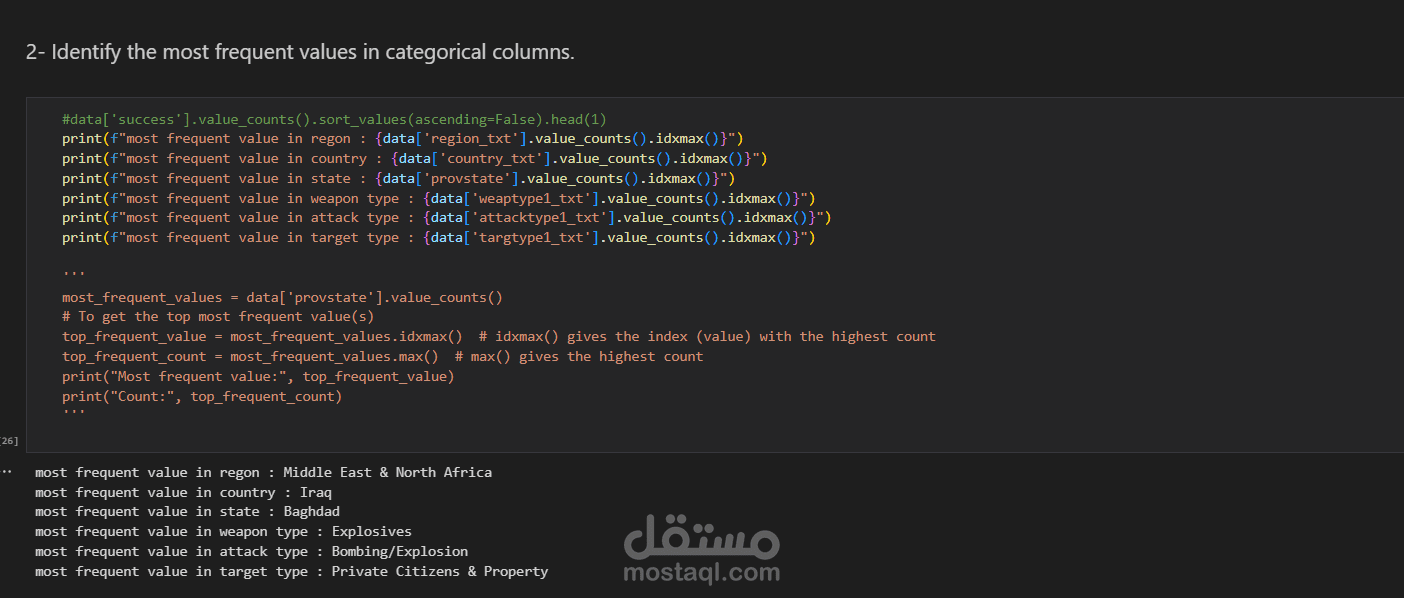
2- Identify the most frequent values in categorical columns
3- Group data by various categories (e.g., year, region, attack type) and calculate aggregate statistics
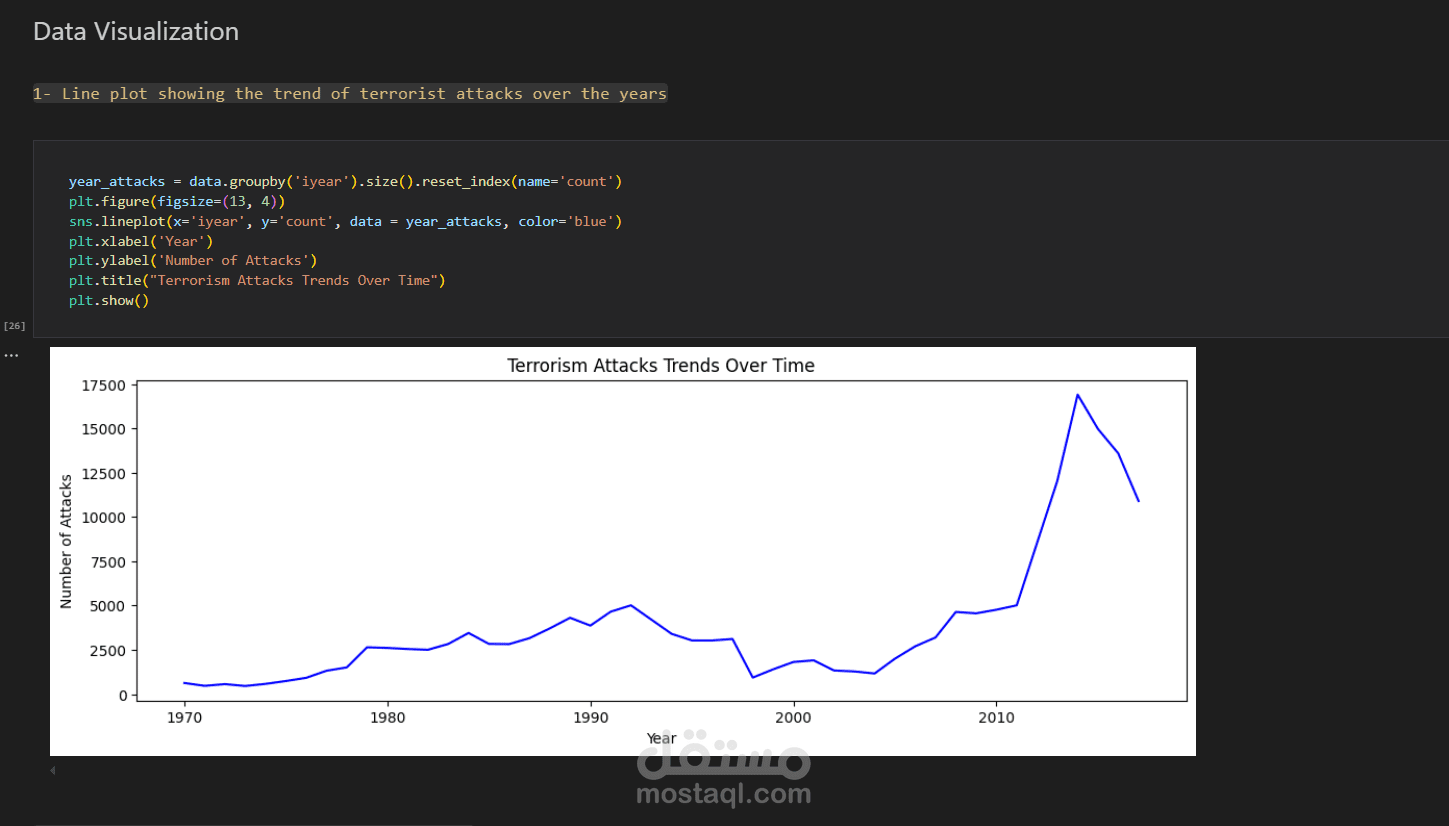
4- Identify trends over time (e.g., number of attacks per year).
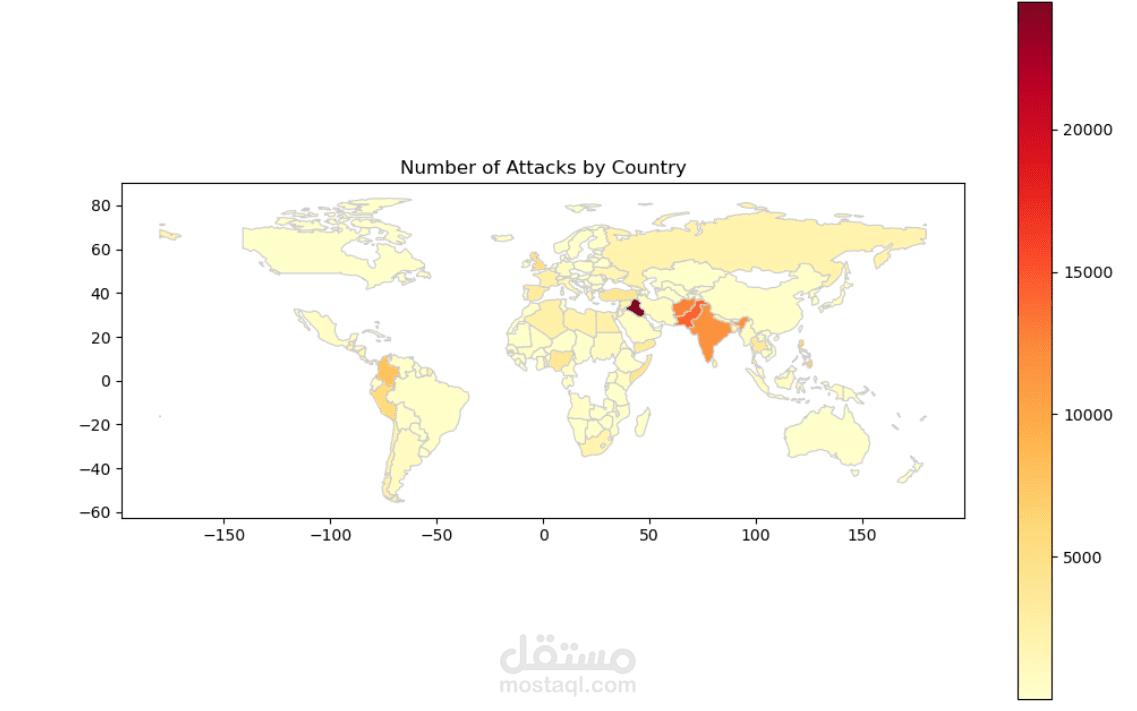
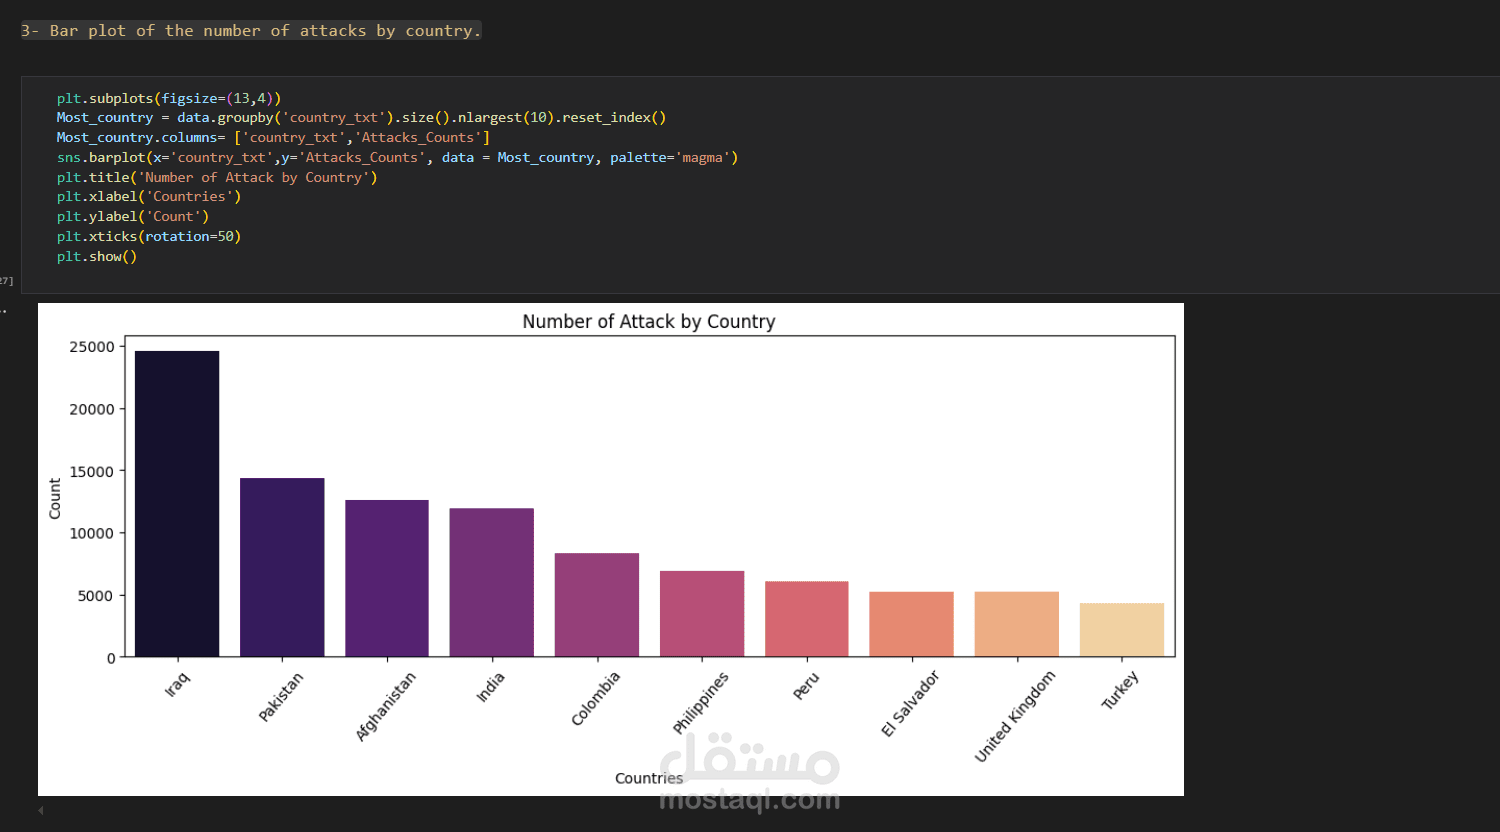
5- Determine the most affected regions and countries
6- Identify the most common attack types and targets
3rd. Data Visualization
1- Line plot showing the trend of terrorist attacks over the years
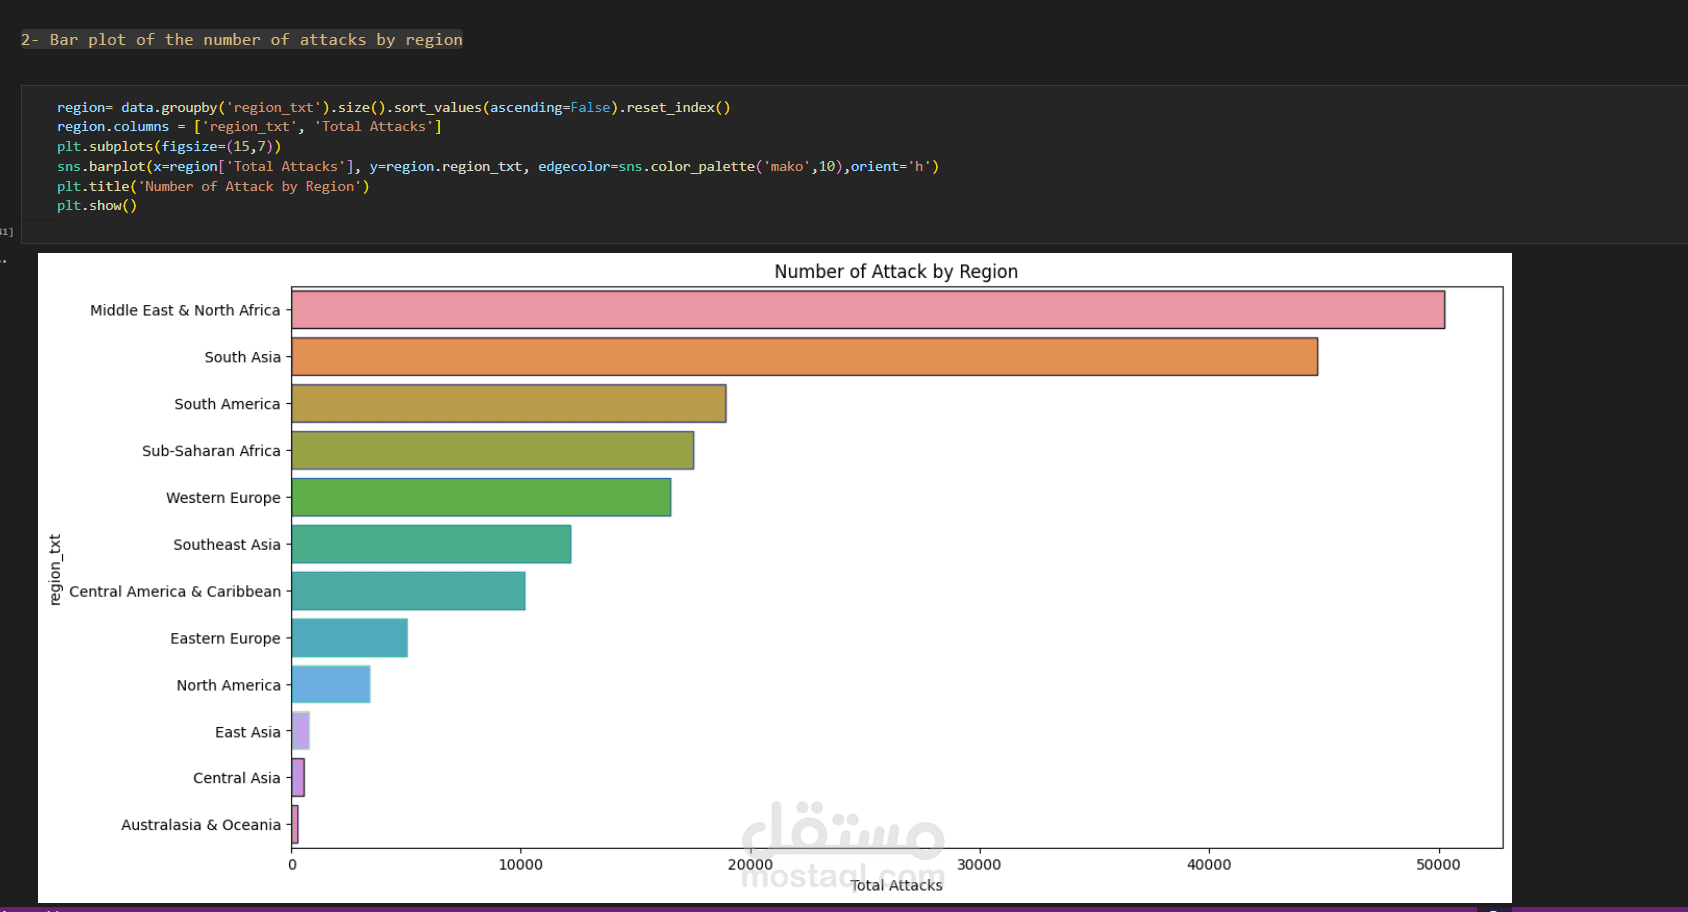
2- Bar plot of the number of attacks by region
3- Bar plot of the number of attacks by country
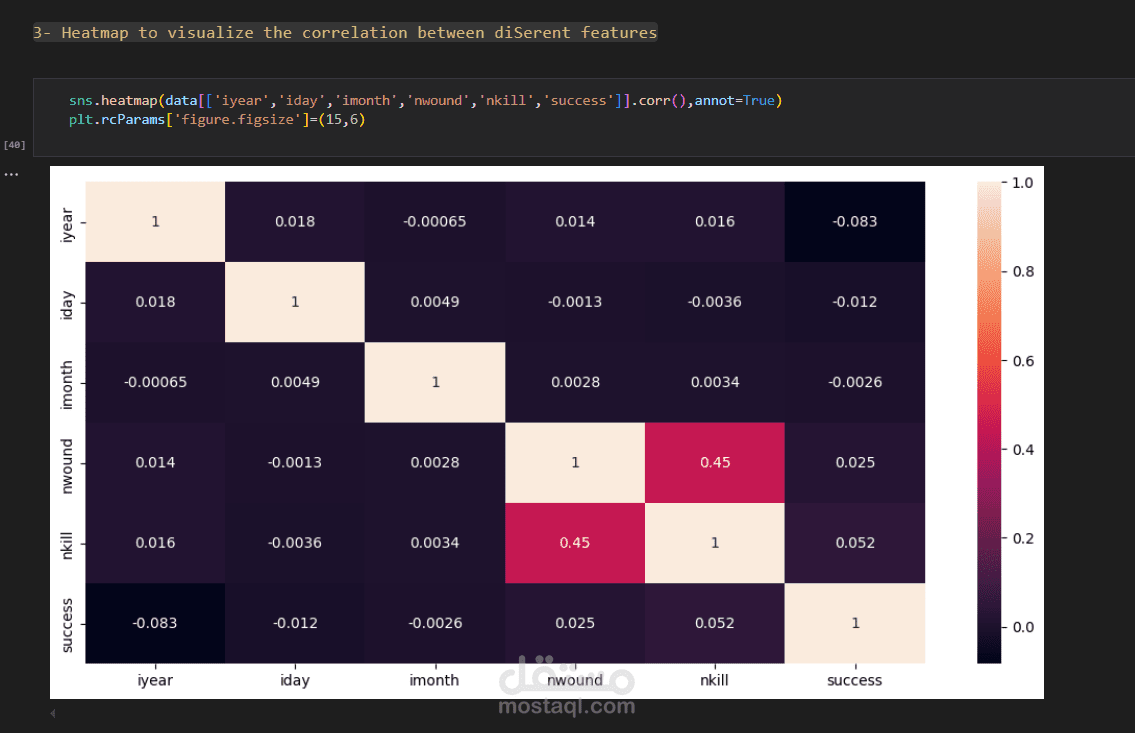
4- Heatmap to visualize the correlation between different features
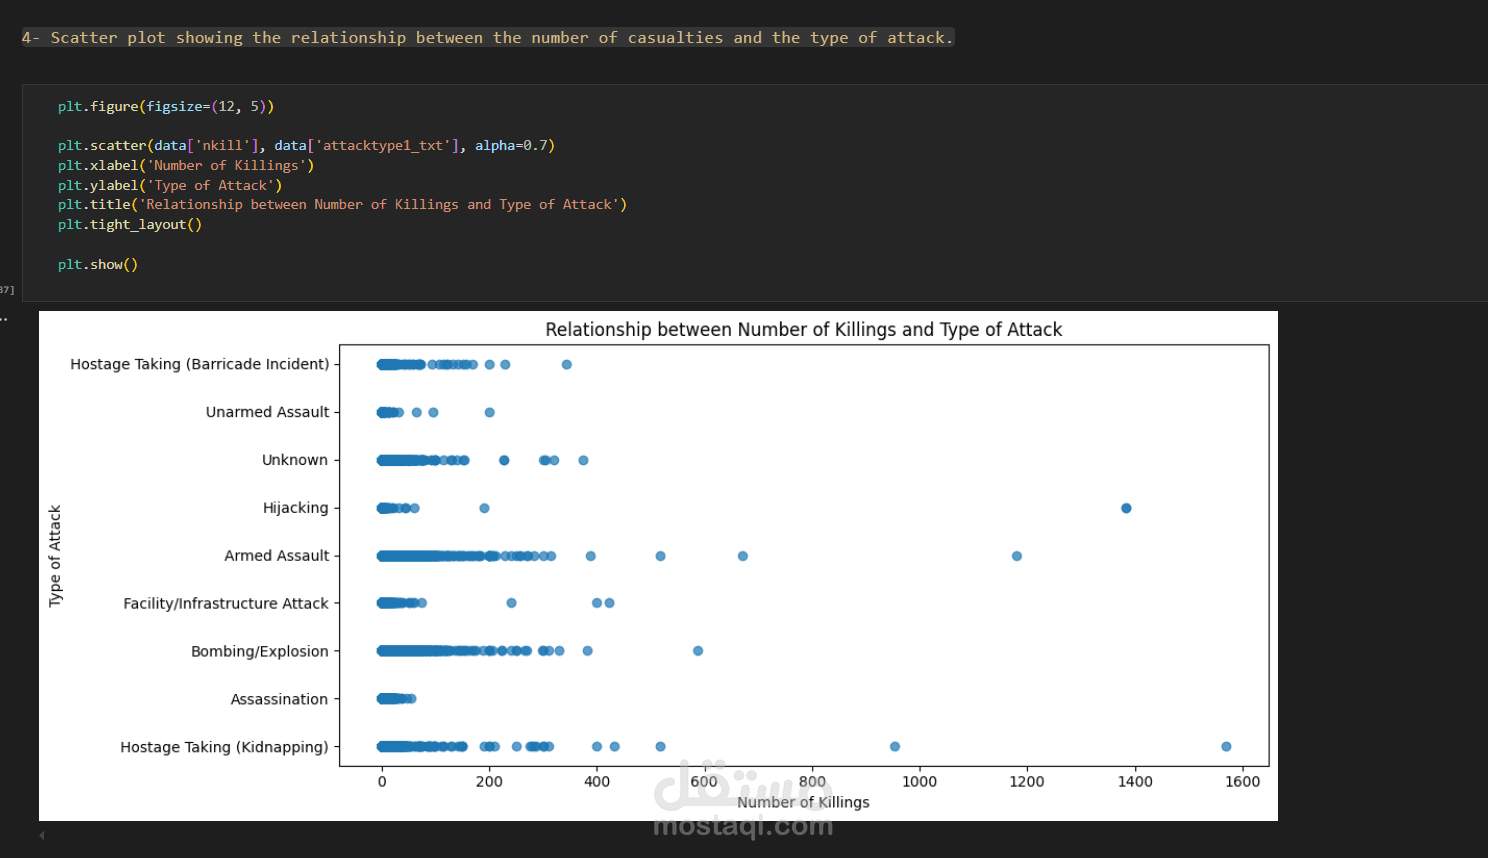
5- Scatter plot showing the relationship between the number of casualties and the type of attack.
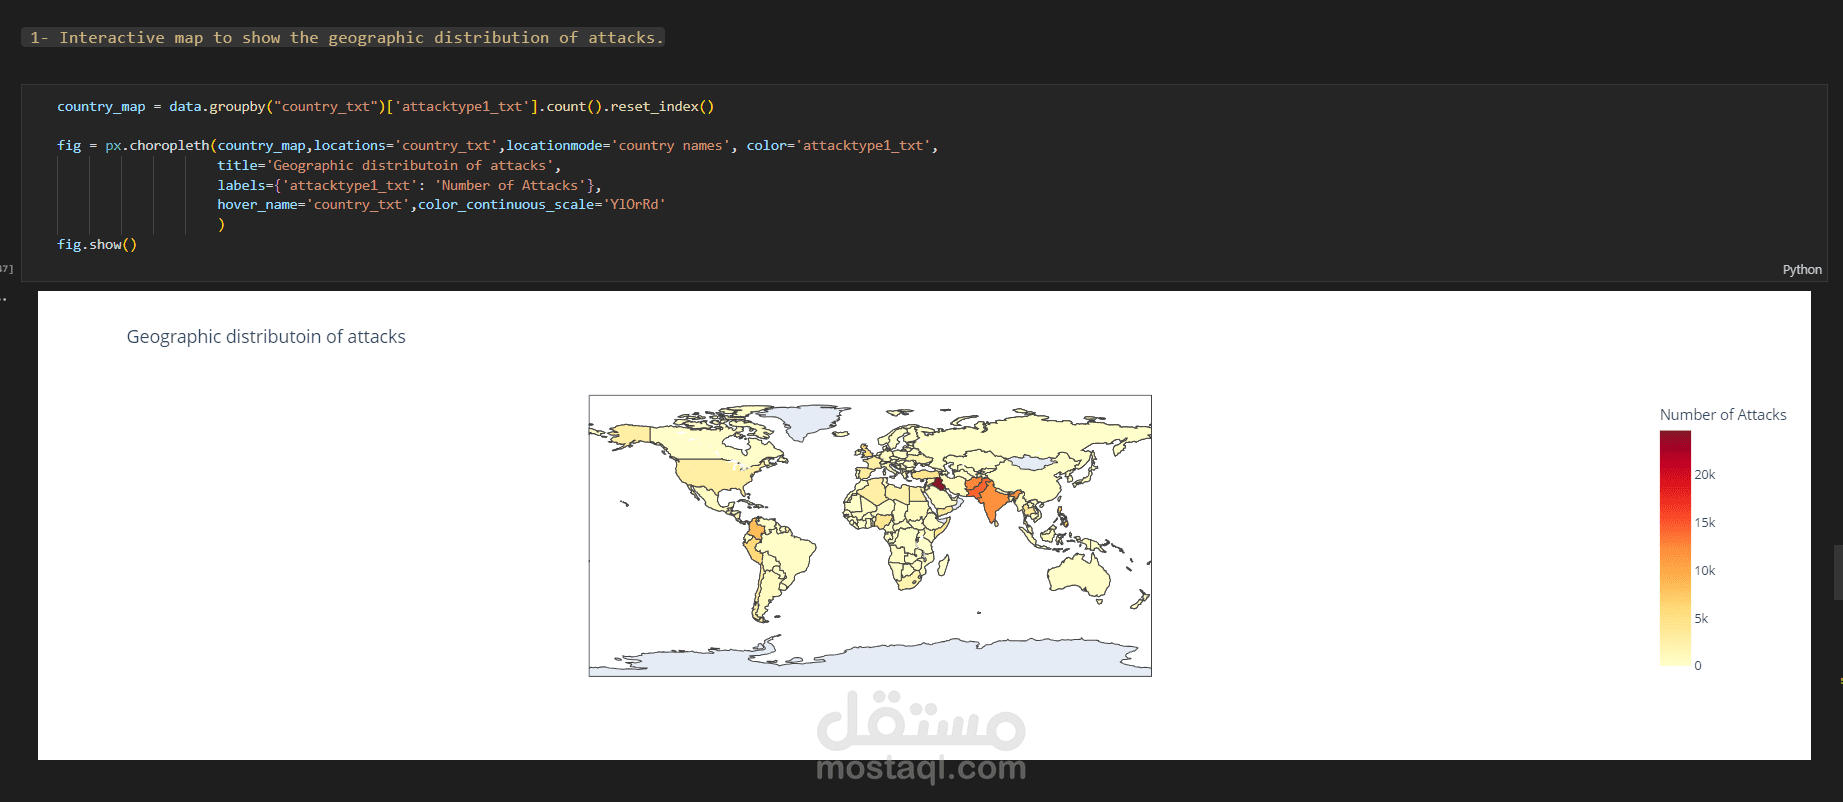
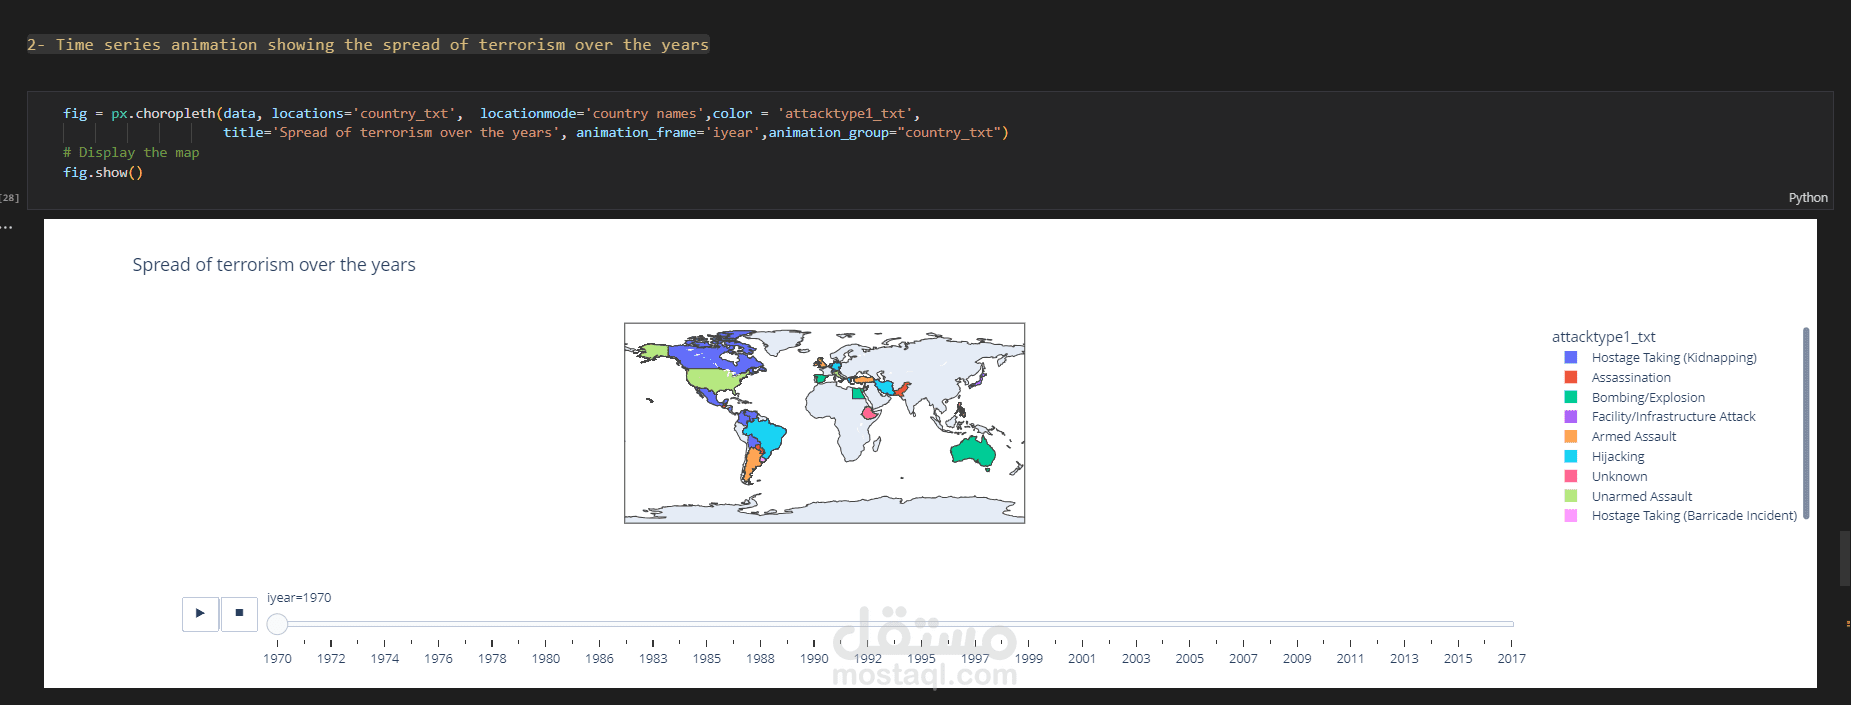
* Create interactive visualizations using Plotly
1- Create interactive visualizations using Plotly (optional for advanced students)
2- Time series animation showing the spread of terrorism over the years
4th. Demonstrate how to use Dask and Compare the performance and memory usage of Dask operations with Pandas
- Create function (calculate ()) to calculate the time & memory usage