UEFA Championship Analysis Using Power BI
تفاصيل العمل

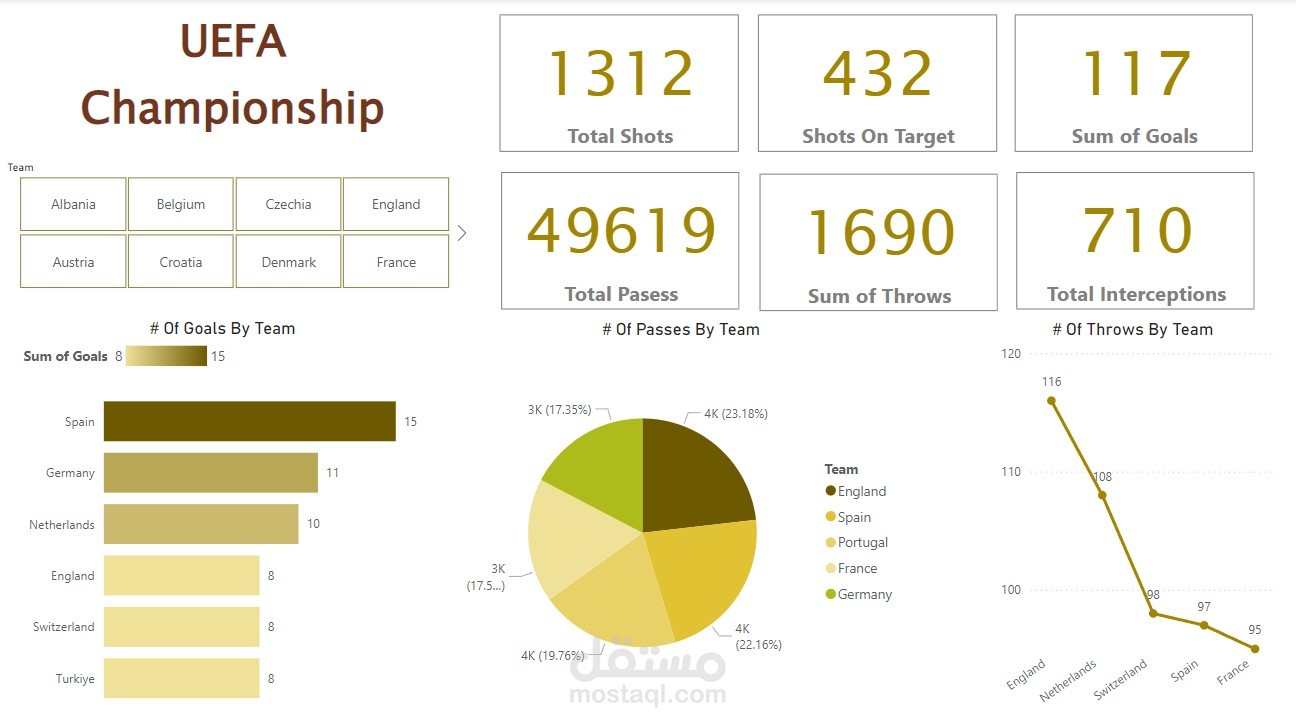
UEFA Championship Dashboard This Power BI dashboard provides an insightful overview of key performance metrics from the UEFA Championship. It is designed to allow users to easily explore and analyze the performance of different teams across various statistical categories.
Dashboard Highlights
Team Selection Panel:
The top section features a selection panel where you can filter the data by choosing a specific team. This makes it easy to drill down into the performance metrics of individual teams. High-Level Metrics:
Total Shots: 1,312 Shots on Target: 432 Sum of Goals: 117 Total Passes: 49,619 Sum of Throws: 1,690 Total Interceptions: 710 Visual Breakdown:
Of Goals By Team:
Spain leads with 15 goals, followed by Germany with 11, and the Netherlands with 10. Several teams, including England, Switzerland, and Turkey, each scored 8 goals.
Of Passes By Team:
The pie chart shows the distribution of passes among the top teams, with England, Spain, and Portugal making a significant share of the total passes.
Of Throws By Team:
The line chart tracks the number of throws by each team, highlighting England with the highest at 116 throws, followed by Switzerland and Spain. Usage: This dashboard is a great tool for analyzing team performance during the UEFA Championship. It allows coaches, analysts, and fans to compare teams' effectiveness in different aspects of the game, such as shooting, passing, and defensive actions like interceptions.
Visuals: The bar chart and pie chart provide clear and immediate visual comparisons between teams. The line chart adds depth to the analysis by showing trends in the number of throws over time.