Data Preprocessing, Analysis, and Visualization
تفاصيل العمل
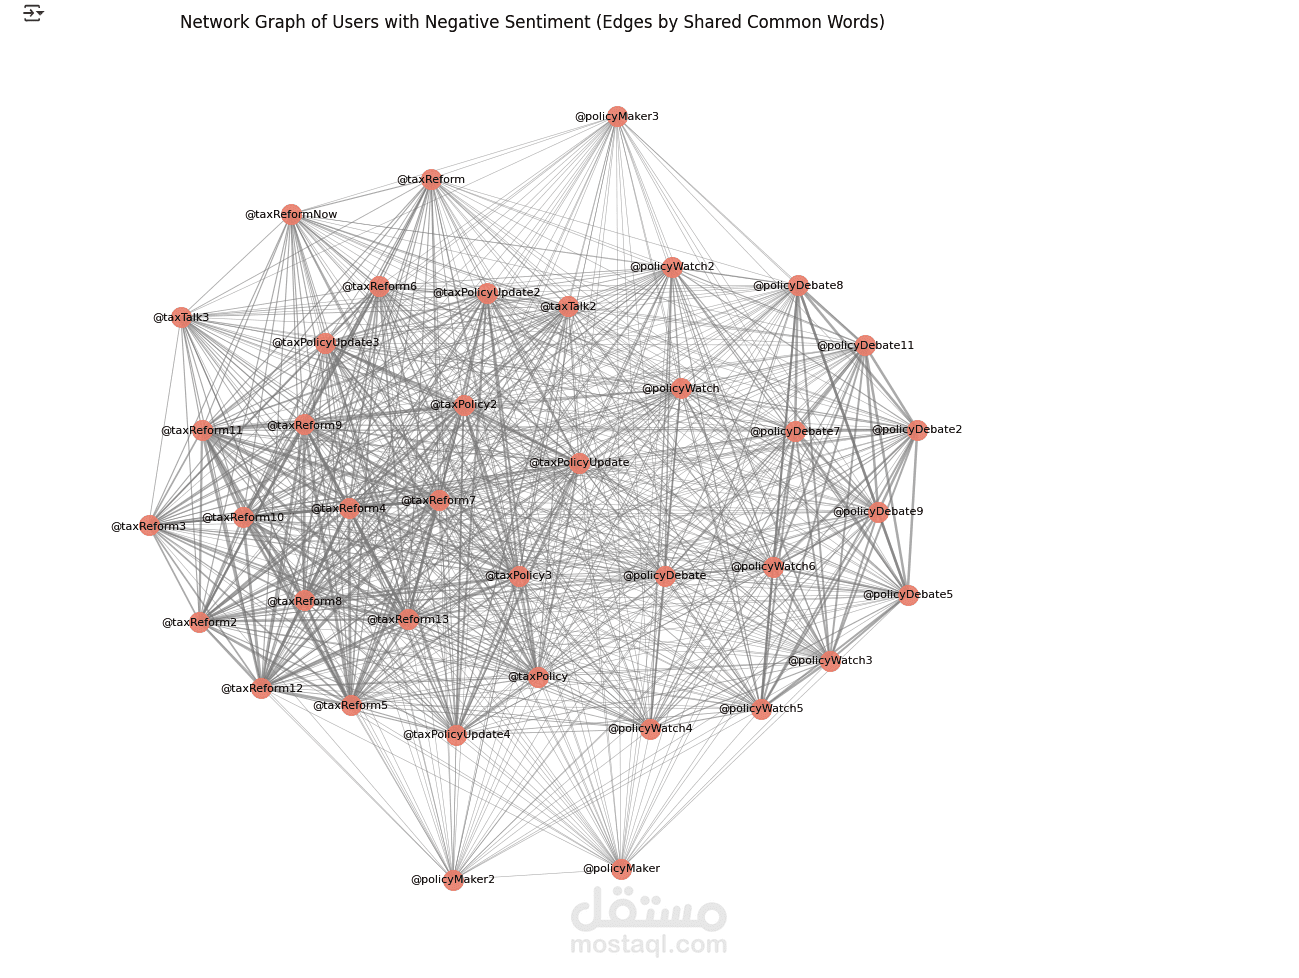
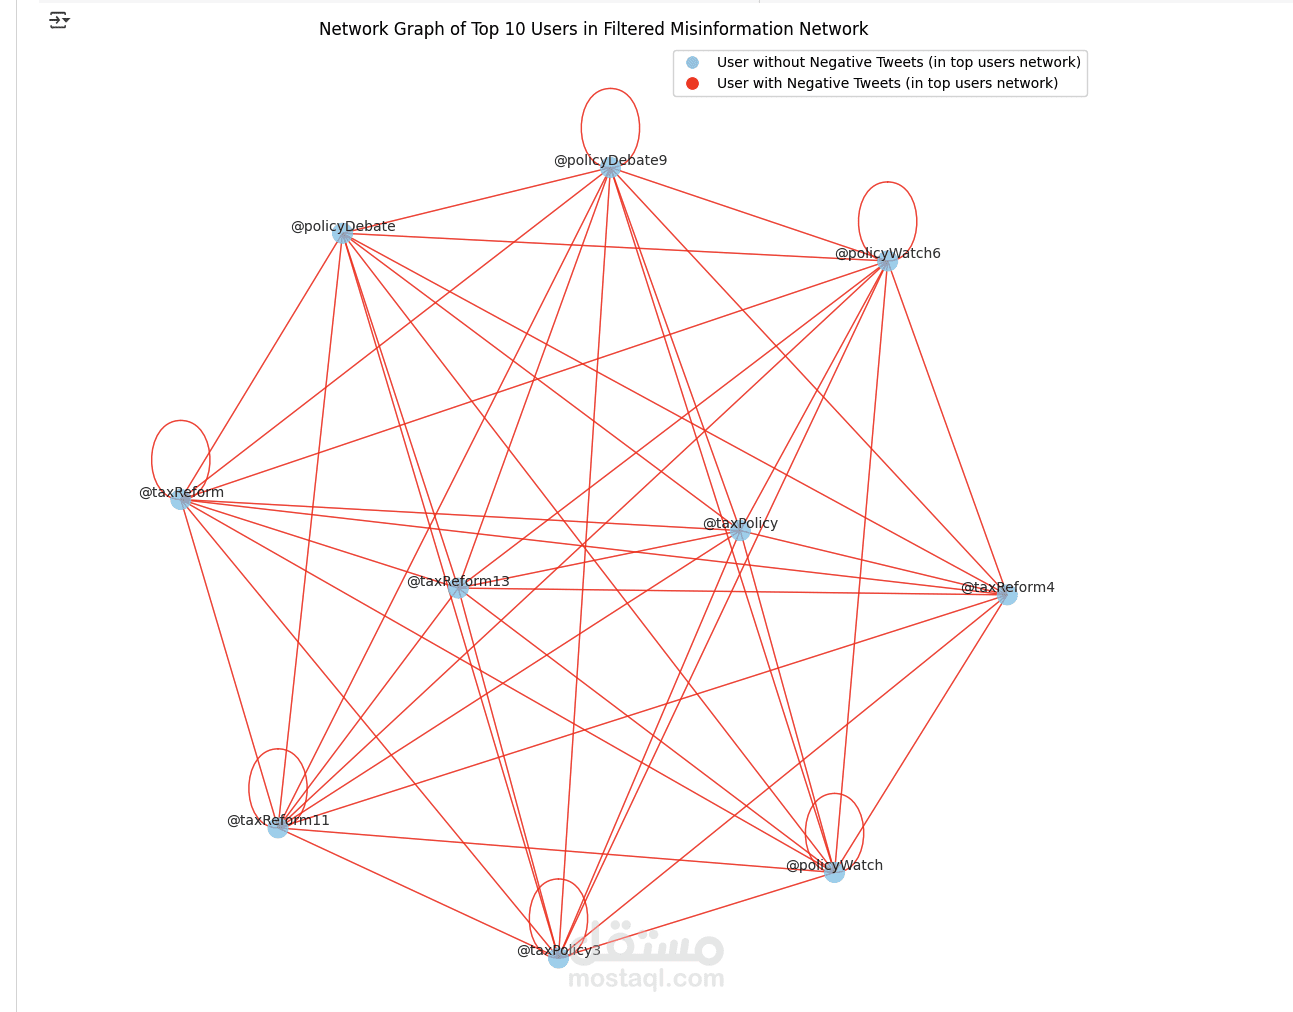
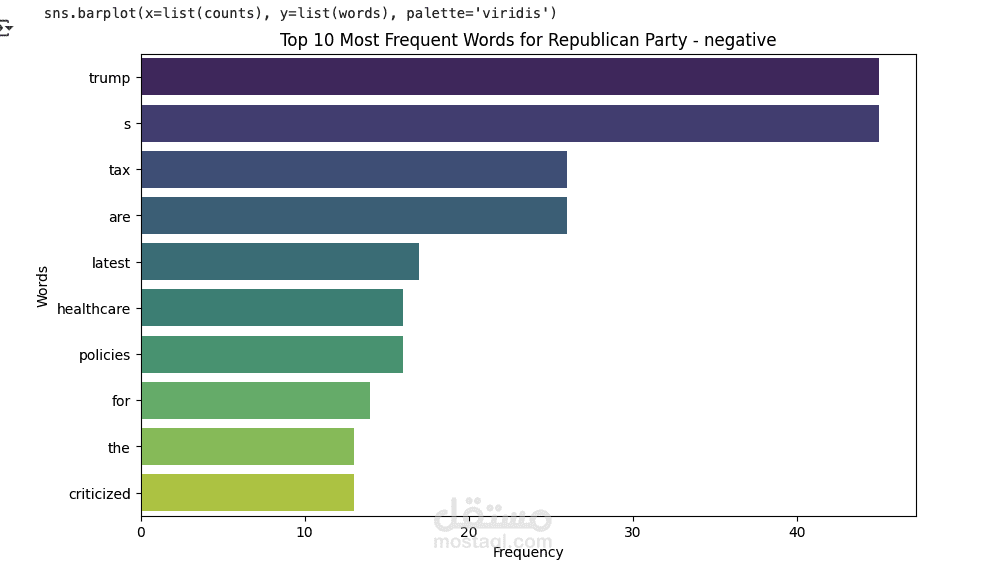


In this project, I was responsible for cleaning, preprocessing, and analyzing a large dataset to uncover key insights and trends. The goal was to prepare raw data for machine learning pipelines and create visualizations that supported data-driven decision-making.
I used Python with tools such as Pandas, NumPy, and scikit-learn for data preprocessing, which included handling missing values, feature engineering, normalization, and encoding categorical variables. For the analysis and visualization, I used Matplotlib, Seaborn, and Plotly to generate interactive dashboards and detailed charts that highlighted relationships, patterns, and outliers in the data.
This project played a crucial role in helping stakeholders understand their data better and optimize business strategies. It also improved the accuracy and performance of downstream predictive models by ensuring high-quality input data