Airline Dashboard - Power Bi
تفاصيل العمل

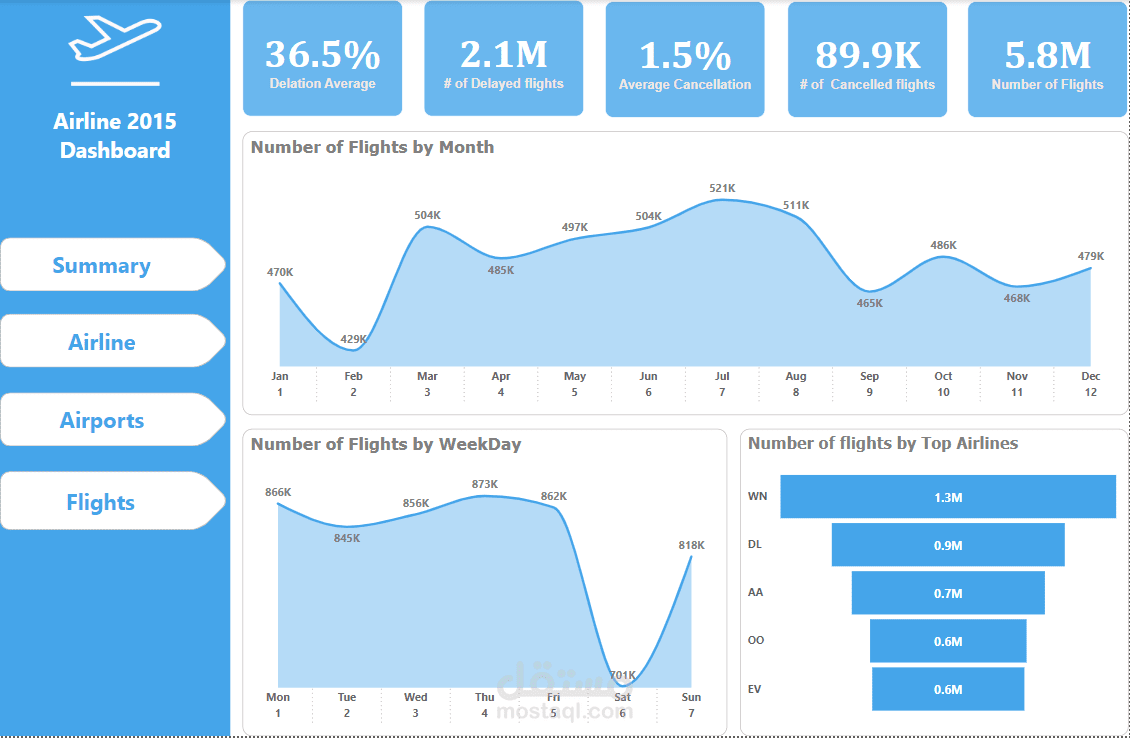
In this Project, I was supposed to analyze US Airline 2015 Data.
I connected to the data from Kaggle using python Script to ensure that any updates in the data reflects in Power Bi reports.
The Dashboard Consists of 4 Report Pages.
1- Summary: Indicates the flights volume over the year
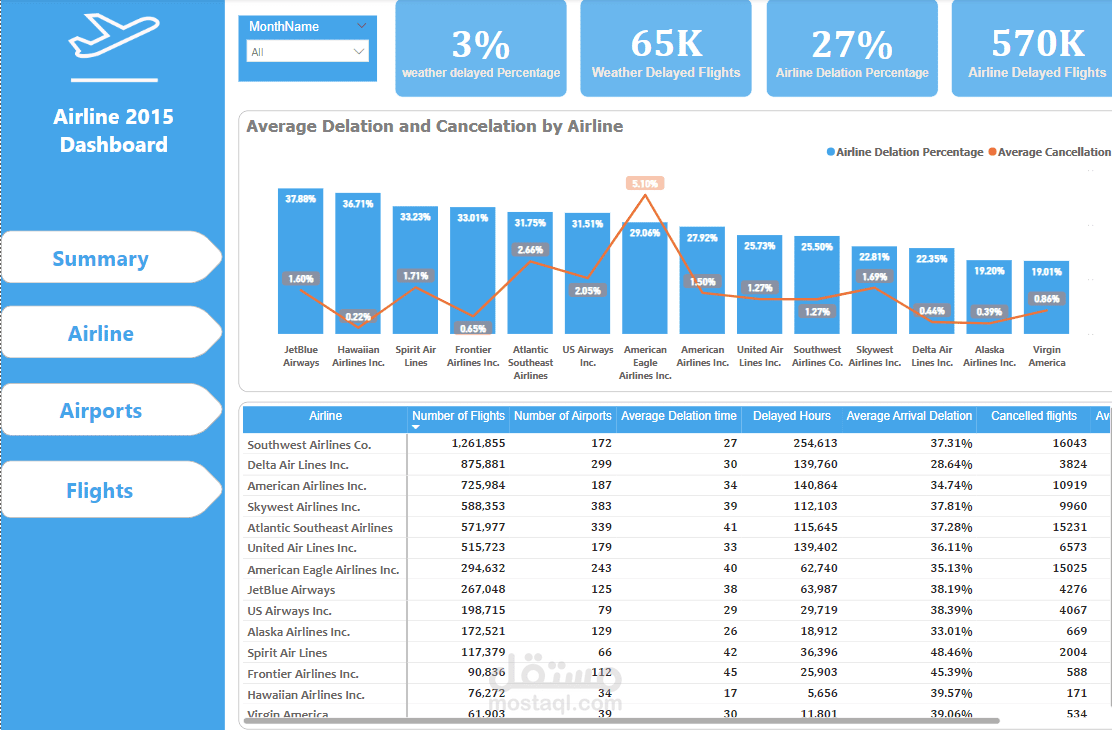
2- Airline: Indicates each Airline's flight volume, delay and cancelation
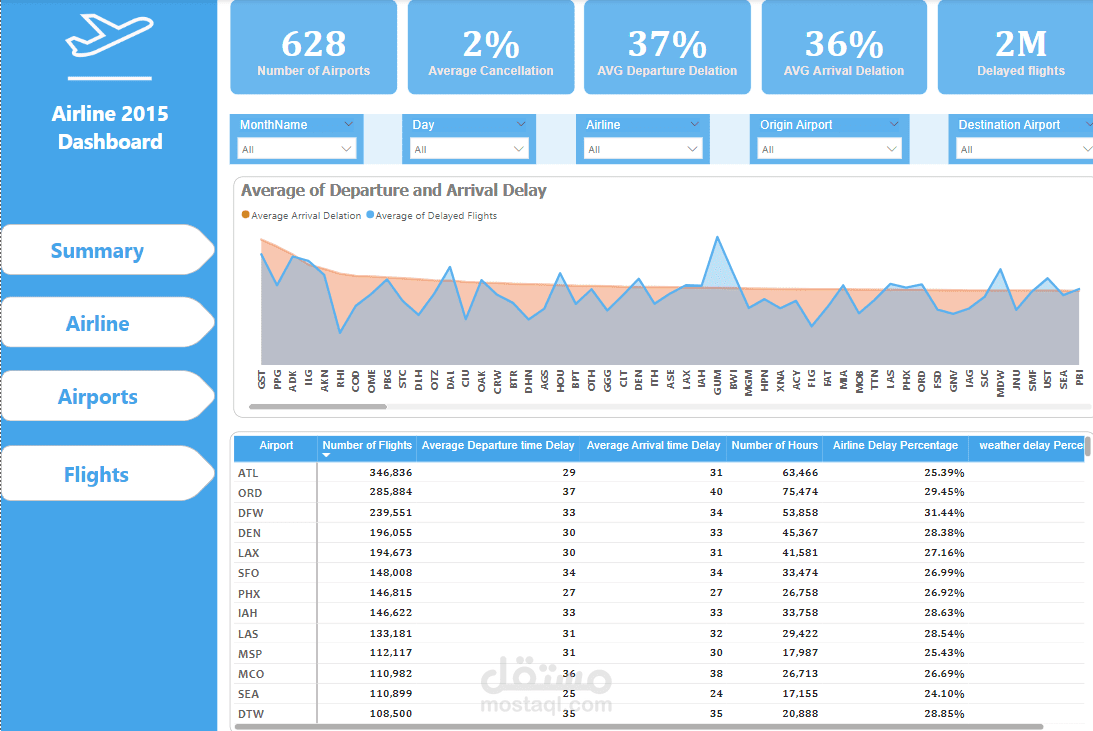
3- Airport: Indicates each Airport's Departure and Arrival delay and cancelation average
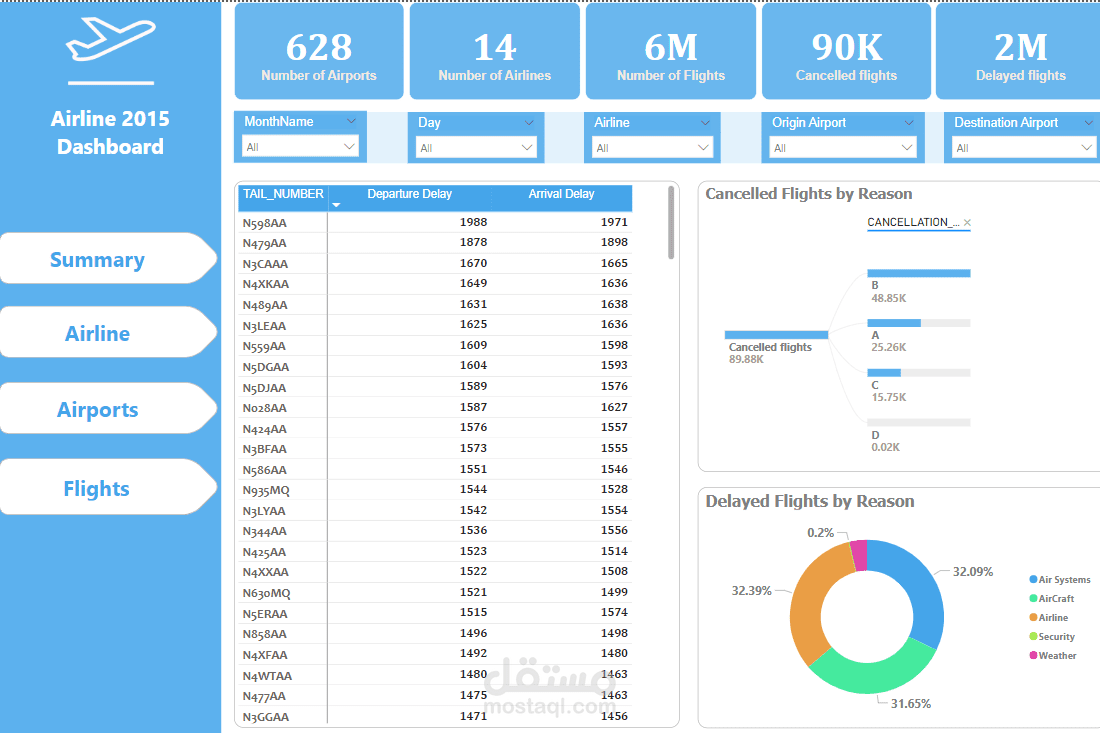
4-Flight: Indicates the delay and cancelation reasons for all flights, top flights delay and flights volume.