AdventureWorks Data Analysis ً using Power Bi
تفاصيل العمل
This project involves analyzing sales data for AdventureWorks, a fictitious company that sells outdoor equipment. The analysis focuses on product sales, and get a useful insight to
enchance the bussines. The dashboards provide insights into total sales, Product Category and a Comirson between the total sales over terriort comapring by Canda.
First Process:
Data Source: collecting data from OLTP “Direct Query”
Data Modelling: Star Schema
All Process
Data Collection: Gathered sales data from AdventureWorks database 'OLTP".
Data Extraction : Creating views to use it into power bi , Retrieved data from essential tables, views and function.
Date Table Creation: Implemented an M language script to generate a comprehensive date dimension table for enhanced time-based analysis.
Data Transformation: Cleaned and prepared the dataset by renaming tables and columns and removing unused data.
Data Modeling: Structured data into a star schema for efficient querying and analysis.
Measures: Created a set of critical measures for analysis, including the use of Orders by Order Date Measure to understand the trend of our orders in the data set.
Data Analysis: Performed descriptive statistics and trend analysis.
Data Visualization: Created interactive dashboards using Power BI .
Reporting: Summarized findings and prepared reports for stakeholders.
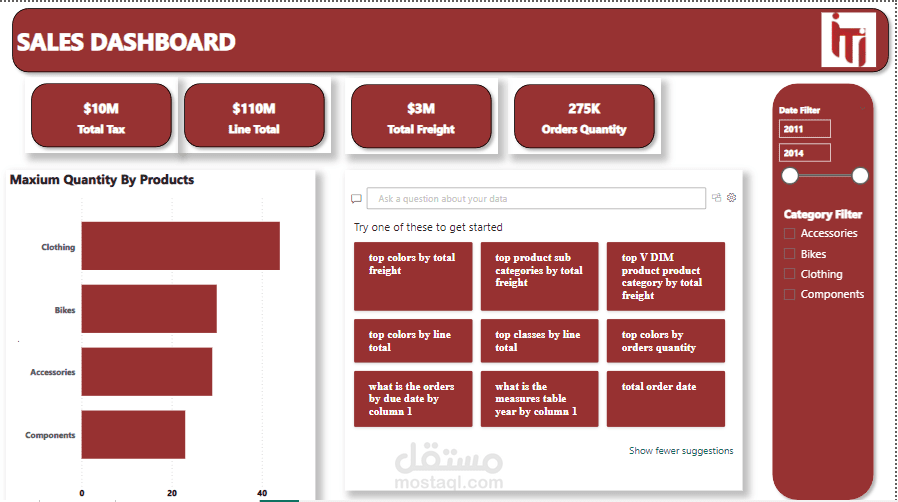
Product Dashboard
Total Tax: $10M
Line Total (Total Sales): $110M
Total Freight:$3M
Orders Quantity: 275K
SalesDashboard:
The Maxium Quantity for each Product per Order:
Clothing: 44
Bikes: 30
Accessories: 29
Components : 23